Assessing and Managing complexity of supply chains:
An empirical study in the Made-in-Italy sectors
Nunzia Carbonara1
DMMM, Politecnico di Bari, ITA
Ilaria Giannoccaro
DMMM, Politecnico di Bari, ITA
ABSTRACT
This paper develops a conceptual framework to assess the complexity of the supply chain. The framework is built on the theory on complex adaptive systems. In particular, extracting the main properties of complex adaptive systems the framework associate to each property a set of supply chain features. The conceptual framework is applied to two case studies in the Made-in-Italy sector. The analysis aims at assessing the complexity of the considered supply chains as well as at formulating theoretical propositions that relate the SCs' features with different level of complexity.
Introduction
Literature on supply chain management widely recognizes the complexity of the supply chain (SC). The number of firms to be integrated, the need to share critical information on key strategic data, the multiple sources of uncertainty that plague its performances, the unpredictable and non-linear effects of the local decisions on the global behaviors make SC as complex system (Bozarth et al., 2009; Lee et al., 1997; Perona & Miragliotta, 2004; Simchi-Levy et al., 2002). Traditionally, theories and methodologies used in supply chain management (SCM) tended to reduce such a complexity rather than to manage and exploit it. To do this, complexity science is the best approach, offering both theories and methodological tools to study the properties and behaviors of complex adaptive systems (CASs), which are systems of agents that emerges over time into a coherent form, and adapts and emerges itself without any singular entity deliberately managing or controlling it (Holland, 1995). Complexity science aims to explain how heterogeneous agents "self-organize" to create new structures in interactive systems, with the goal of understanding how such structures emerge and develop (Casti, 1997). In this paper, we propose a conceptual framework that allows assessing the complexity of the SC by evaluating how and to what extent the SC is configured as a CAS. The conceptual framework is built on the main properties of CAS and translates each property in a set of SC features. The framework differs from the previous CAS-based models of the SC for the following main reasons: it presents a wider conceptualization of the CAS properties; it refers to the entire SC including both the supply and the distribution networks; it proposes a set of qualitative/quantitative measures of such properties for a SC setting based on the referred SCM literature.
We apply the conceptual framework to two case studies in two Made-in-Italy sectors, fashion and furniture. The analysis aims at assessing the complexity of the considered SCs. By comparing the two case studies, we formulate a set of theoretical propositions that relate the SCs' features with different level of complexity.
Theoretical background
Complex adaptive systems
The notion of CASs has its roots in the biological sciences (Gell-Mann, 1994) and refers to a system that emerges over time into a coherent form, and adapts and emerges itself without any singular entity deliberately managing or controlling it (Holland, 1995). Examples of CASs include social systems, ecologies, economies, cultures, politics, technologies, traffic, weather, etc.. A number of researchers have developed concepts and notions to explain CASs: Gell-Mann (1994), Holland (1995), Axelrod and Cohen (1999), Choi et al. (2001), Lane (2002). The basic elements of CASs are agents, which are autonomous units that seek to maximize some measure of goodness, or fitness, by evolving over time. Agents scan their environment, which includes both other agents within the CAS as well as the external environment, and develop a mental model (schema) representing interpretative and action rules. Actions define the interactions of agents with each other inside and outside the boundaries of the CAS, they involve the exchange of information and/or resources. CAS complex behaviour arises from the interaction among system agents and between the system and its environment (Mitleton-Kelly, 2003).
| Variety of elements | CASs are formed by a great number of heterogeneous agents with different attributes, goals, and actions. | |
| Agents with common schema | Agents possess common mental model, both interpretative and behavioural, that refers to norms, values, and beliefs. | |
| Connectivity | Agents are linked by a dense network of interactions that involve the exchange of information and/or resources | |
| Decentralized control | Agents of a CAS are semi-autonomous entities. The CAS behaviour emerges over time into a coherent form without any singular entity deliberately managing or controlling it. | |
| Non-linearity | The CAS behaves in a nonlinear fashion. This essentially means that there is not a direct correlation between the size of cause and the size of the corresponding effect. Holland ([1995](#)vO9gDr) suggests that almost all CASs exhibit lever point phenomena, where small “inexpensive” inputs cause major directed effects in CAS dynamics. Thus, while many small events occur all the time, butterfly effects are small events that spiral into dramatic or extreme outcomes. Holland’s points is that some small events can be levered or otherwise instigated such that they have increased probability of producing dramatic outcomes. | |
| Self-organization and Emergence | Agents interact for some motive, such as tension reduction, learning, fitness or performance improvement, etc., without any entity managing and controlling them. In this way, they self-organize determining the emergence of order. The emergent order concerns new properties and/or structures of the system that come into being in an unexpected way, given the known attributes of component agents and environmental forces. Emergence depends on both bottom-up effects and top-down effects. | |
| Adaptation | Agents learn and adapt, that is they modify their rules as experience accumulates, searching for improvements. | |
| Co-evolution | The dynamic environment, by interacting with the CAS, forces changes in the entities that reside within it, which in turn induce changes in the environment. Therefore, co-evolution is the dominant means of achieving adaptation of the system. | |
| Dynamic environment | The dynamic environment, by interacting with the CAS, forces changes in the entities that reside within it, which in turn induce changes in the environment (co-evolution). |
Table 1. CAS Properties.
An important point emphasized by many authors is that CASs co-evolve with a changing environment. That is, the dynamic environment, by interacting with the CAS, forces changes in the entities that reside within it, which in turn induce changes in the environment (co-evolution). Referring to Kauffman (1993), he observes that organisms do not merely evolve, they co-evolve both with other organisms and with a changing environment, and he describes the co-evolution as a process of coupled, deforming landscapes where the adaptive moves of each entity alter the landscapes of its neighbours.
Therefore, agents within a CAS self-organize to create new emergent structures, patterns, and properties. The latter arise from the interaction among agents without being externally imposed on the system (Goldstein, 1999); they are greater than the sum of the parts and may be difficult to predict by studying the individual system elements.
Our framework for summarizing CAS properties is reported in Table 1 (Choi et al., 2001; Dooley, 1997; Kauffman, 1993).
Supply chains as complex adaptive systems
It is widely recognized in the literature that supply chains are complex systems. Such a complexity is due to: the number of firms to be integrated both horizontally and vertically along the value chain; the variety of firms in terms of organizational culture, size, location, and technology; the levels and motives of interconnection among them; the need to share critical information on key strategic data; the multiple sources of uncertainty that plague performances; the unpredictable and non-linear effects of the local decisions on the global behaviors (Choi & Hong, 2002; Choi & Krause, 2006; Lee et al., 1997; Simchi-Levy et al., 2002).
The best approach to deal with the complexity is to use complexity science that offers both theories and methodological tools to study the properties and behaviors of CASs. Complexity science aims at explaining how heterogeneous agents "self-organize" to create new structures in interactive systems, with the goal of understanding how those structures emerge and develop (Casti, 1997).
Oppositely to traditional theories and methodologies used in SCM that tend to reduce the complexity, complexity science permits to manage and exploit it.
Recently, some scholars have investigated the opportunity to adopt the CAS theory to study the supply chain (Choi et al., 2001; Pathak et al., 2007; Surana et al., 2005).
Furthermore, CAS theory has been used to identify and describe the complexity dimensions of the supply chain. Choi and Hong (2002) propose to measure the supply chain complexity in terms of horizontal, vertical, and spatial indicators: the average number of entities across all tiers, the average number of entities in all possible vertical supply chains, and the average geographical distance between companies in the top two tiers in the network, respectively.
Choi and Kruase (2006) use the CAS theory to identify the key aspects of the supply-base complexity: the number of suppliers, their variety, and the inter-relationships among them.
Bozarth et al. (2009) define supply chain complexity as the level of detail complexity and dynamic complexity exhibited by the products, processes and relationships that make up a supply chain.
A conceptual framework to assess the complexity of the supply chain
Using the properties of CAS, we develop a framework that links each CAS property to a set of SC features (Table 2). The framework allows assessing the complexity of the SC by evaluating how and to what extent the SC is configured as a CAS.
Our framework differs from the previous CAS-based models of the SC because: it presents a wider conceptualization of the CAS properties; it refers to the entire SC including both the supply and the distribution networks; it proposes a set of qualitative and quantitative measures of such properties for a SC setting based on the analysis of the SCM literature.
| CAS Properties | SC Features |
|---|---|
| Variety of elements | - Vertical depth - Horizontal width - Geographical dispersion |
| Agents with common schema | - Use of common formalized practises that rule the relationships with suppliers/distributors - Use of performance measurement and control schema |
| Connectivity | - Existence and intensity of the relationships between the focal company and the entire supply network, from the first-tier suppliers to the raw material suppliers - Existence and intensity of the relationships between the focal company and the entire distribution network, from the first-tier customers to the final customers - Existence of horizontal relationships in the same supply network stage - Existence of horizontal relationships in the same distribution network stage - Level of information sharing between the focal company and suppliers/distributors |
| Decentralized control | - Number of decision makers in the SC - Adoption of coordination mechanisms that align firm incentives across the supply chain |
| Non-linearity | - Effects on the focal company performances due to supplier/distributor innovations |
| Self-organization and Emergence | - Supplier/distributor turnover - The extent to which the focal company forces to their first-tier suppliers/distributors the choice of specific second-tier suppliers/distributors |
| Adaptation | - Reactions to strategic moves of competitors to maintain the market shares - The ability to change the production volume/product mix (volume and mix flexibility) |
| Co-evolution | - Time to market - Percentage of new products - The extent to which suppliers/distributors are involved in the new product development |
| Dynamic environment | - Change in final consumer behaviour - Change of the competitive scenario - Change in the sector norms and standards |
Table 2: The conceptual framework.
Methodology
This paper applies a multiple-case study methodology (Yin, 1984). This methodology is particularly appropriate when theory building is the main aim of the research and a further exploration on the constructs of the theory is required.
The case studies involve two SCs belonging to the textile-clothing and furniture sectors. The selected cases of SCs well fits the aim of our study as they offer the possibility to investigate all the SC features described in the conceptual framework both in the supply and distribution networks.
Organizations and informants
To collect all data concerning the two SCs we visited the two firms belonging to the assembly stage of the two SCs, each firm representing the focal company of the SC. In this way the attendant SCs are identified by adopting the procedure suggested by Cooper and Lambert (2000), namely by considering as members of the SC companies with whom the focal company interacts directly or indirectly through its suppliers or customers. Thus, the resulting SC consists of the member firms and the links between these firms.
Even though this approach to investigate the SC could reduce the validity of our analysis, we believe that it presents the unquestionable advantage to be very easy to be adopted. Furthermore, the focal companies provided all the information on the distribution and supply networks relevant for the analysis, so making not needed to extend the analysis to the firms belonging to the two networks.
| Mafrat | Contempo | |
|---|---|---|
| Sector | Clothing | Furniture |
| Turnover (2012) | € 31 million | € 120 million |
| Number of employees | 150 | 140 |
| Competitive position in the sector | Leader | Follower |
| Number of stages of the SC | 9 | 8 |
| Number of suppliers in the first-tier supply stage | 100 | 60 |
| Spatial distribution of retailers | 4% Italy 50% Europe 33% US 13 % Australia | 65% Italy 26% Europe 4% US 5% other countries |
| Supply strategy | Competitive strategy (multiple sourcing policy) | Collaborative relationships (single sourcing policy) |
| Product life-cycle | Short (about 6 months) | Long (more than 1 year) |
| Competitive priorities | Service level | Product quality |
Table 3. Overview of the companies visited.
The two selected focal firms are Mafrat and Contempo. Mafrat is a leading firm located in Southern Italy specialized in the baby and kids clothing production. In 2012 the turnover was 31 million of euros and the number of employees was 150 with more than 2000 external workers. Contempo is a firm located in Southern Italy specialized in the sofa production. In 2012 the turnover was about 120 million of euros.
Three types of informants were contacted: sales manager, to collect information about the distribution network; the operations/production manager and the buyer, to gather information on supply network. Summary information on the two companies visited is presented in Table 3.
Data sources
In each case the research was conducted over a period of four months using both quantitative and qualitative data collection methods. Data came primarily from three sources: documents, in depth face-to-face interviews with the operations managers, and semi-structured interviews using a detailed questionnaire.
Documents
We mainly analyzed the bill of material and further documents referring to suppliers/customers evaluation.
Face-to-face interviews
Face-to-face interviews was useful to map the entire SC of the two focal firms in terms of members and types of links among them. Repeated visits were made to finish interviews or to pick additional information. Each interview usually took three hours on average. The interviews were conducted by the same people in both the firms.
Questionnaires
The questionnaire aims at assessing the SC complexity by measuring the features identified in the conceptual framework. The adopted quantitative and qualitative measures are shown in Table 4.
| SC features | Description of the measures | |
|---|---|---|
| Variety of elements | Horizontal width Vertical depth Geographical dispersion |
Indicate the number of stages of the SC Indicate the number of firms for each stage 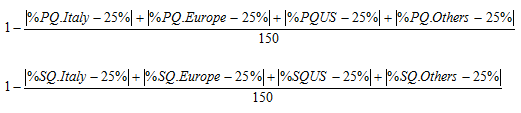 where PQ= purchased quantity in; SQ = sold quantity in |
| Agents with common schema | Use of common formalized practises that rules the relationships with suppliers/distributors Use of performance measurement and control schema |
Indicate the use of formal practices ruling the relationships with suppliers/distributors (high, medium, low) Indicate the use of performance measurements tools along the entire supply chain (e.g. ERP, Extended ERP) |
| Connectivity | Existence and intensity of the links between the focal company and the entire supply network, from the first-tier suppliers to the raw material suppliers Existence and intensity of the relationships between the focal company and the entire distribution network, from the first-tier customers to the final customers Existence of horizontal relationships in the same supply/distribution network stage Level of information sharing between the focal company and suppliers/distributors |
Indicate the extent to which the following statements are true
Indicate the extent to which the following statements are true
Indicate the existence of horizontal relations among suppliers (such as co-design, information sharing on demand, operations costs, and production plan) Indicate the existence of horizontal relations among distributors (such as joint marketing initiatives and information sharing on demand and inventory stocks) Indicate the extent to which the FC shares the following information with suppliers
Indicate the extent to which the FC shares the following information with distributors
|
| Decentralized control | Number of decision makers in the SC Adoption of coordination mechanisms that align firm incentives across the supply chain |
Indicate the extent to which the following operational decisions are jointly planned with suppliers/distributors
Indicate the extent to which the following contractual clauses are used
|
| Non-linearity | Effects on the focal company performances due to supplier/distributor innovations | Indicate the extent to which innovations carried out by supplier/distributor affect the firm performances (e.g. product innovation, new locations of the distributor showroom, new manufacture technologies) (High-Low, 3-point Likert scale) |
| Self-organization and Emergence | Supplier/distributor turnover The extent to which the focal company forces to their first-tier suppliers/distributors the choice of specific second-tier suppliers/distributors |
Indicate
(Always-Never, 3-point Likert scale) |
| Adaptation | Reactions to strategic moves of competitors to maintain the market shares The ability to change the production volume/product mix (volume and mix flexibility) |
Indicate how the firm reacts to competitors strategic moves (such as introduction of new production processes, use of innovative raw materials/components, adoption of new distribution channel, introduction of new advertising tools Rate your capacity to change the product volume and the product mix (High-Low, 3-point Likert scale) |
| Co-evolution | Time to market Percentage of new products The extent to which suppliers/distributors are involved in the new product development |
Indicate
Indicate the extent to which suppliers/distributors are involved in the new product development (High-Low, 3-point Likert scale) |
| Dynamic environment | Change in final consumer behavior Change of the competitive scenario Change in the sector norms and standards |
Rate the variability of changes in
|
Table 4. The measures of the SC features.
Data analysis
Data analysis consists into two steps: firstly, we carried out the within-case analysis in which we deeply investigated the two SCs and then, we employed a cross-case analysis aimed at identifying similarities and differences among the analysed cases and generating theoretical propositions regarding how the SC complexity forges and operates (Choi & Hong, 2002; Sammarra & Belussi, 2006).
Within-case analysis
In the next we present the within-case analysis of the two cases. The quantitative and qualitative data collected for the two SCs are presented in order to characterize each SC in terms of CAS properties. After we go through the two cases, we provide a summary of the key results.
The complexity of the Mafrat supply chain
Variety of the elements
Figure 1 shows that the SC is made up of nine stages including the final customer. Considering the Mafrat as the focal company, the supply network consists of four stages: the first-tier supply stage is formed by the assembling firms, the second-tier stage is made up of components and semi-finished product suppliers, the third-tier stage consists of the worked raw material suppliers, and the forth-tier stage of the raw material suppliers.
The distribution network is formed by three stages: the first-tier stage is made up of the distributors, the second-tier stage of the wholesalers, and the third-tier by the retailers.
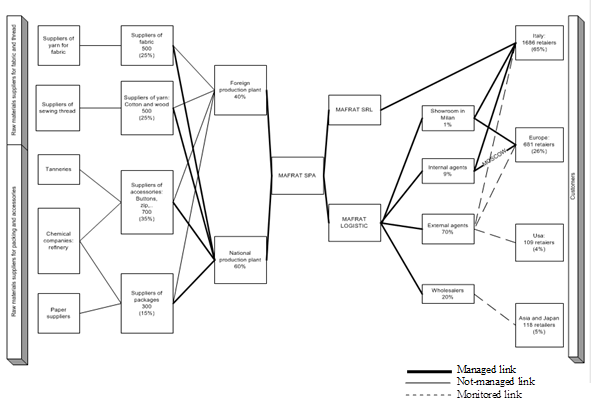
Figure 1: The Mafrat supply chain.
The number of firms at the first-tier supply stage is about 100 with 1700 employees, out of which the 60% are localized abroad mainly in South-Eastern Asia and Eastern Europe; the second-tier supply stage includes about 2000 firms classified into suppliers of yarn (25%) and fabrics (25%), accessorizes (35%), and packaging (15%). The third-tier suppliers and the raw material suppliers provide yarns for textile fibres, yarns for knitted fabric, tanned leather, paper, leather, mother-of-pearl, pearl-shell, and other materials.
The first distribution stage consists of only two firms: the Mafrat Logistics managing the final product flows and the Mafrat Srl managing the final product warehouses.
The second level stage is formed by 100 wholesalers distinguished into internal sales agents (10%), external sales agents (70%), and international buyers (20%). To this stage belongs the showroom. The third level is made up of 2600 retailers: 65% located in Italy, 26% in Europe, 4% in US and 5% in the other world countries.
Thus, the Mafrat SC is characterized by a high vertical and horizontal variety and is geographical dispersed.
Agents with common schema
Across the SC, both in the supply and distribution network, the relationships are scarcely formalized based on few reports and formal documentations. Each firm adopts its own system of performance measurements, although these systems are compatible with those of the Mafrat so as to guarantee the integration.
Connectivity
Figure 1 shows the types of links used in the supply and distribution networks. As to the supply network, Mafrat has managed relationships with all first-tier suppliers and with the second-tier suppliers that supply the assembling firms located in Italy. All other links are not-managed.
As to the distribution network, the links with Mafrat Srl and Mafrat Logistics (first-tier distribution) and with internal sales agents, external sales agents, international buyers, and the showroom are managed. Links with retailers are both managed and monitored.
Therefore, in the supply network there are mainly not-managed links, whereas the links in the distribution network are mainly managed.
In the supply and distribution networks Mafrat has mainly long-term relationships (about 2-4 years). The information sharing is high: Mafrat shares information with suppliers about the inventory stock and delivery time; and shares information on sales forecast, inventory stocks, and customer satisfaction and needs.
To sum up, the connectivity of the SC is high: the distribution network is characterized by a higher connectivity than the supply one.
Decentralized control
The SC is managed by using a decentralized decision making process. In fact, each actor in the SC makes its own decisions about the production plans, the inventory control, sales forecasting, etc.. Moreover, the SC mechanisms to align incentives, such as revenue and cost sharing are not used.
Only in the case of the first-tier suppliers the decision-making is centralized by the Mafrat that acts as a central planner making production and purchasing plans.
Non-linearity
Some unpredictable positive effects on the Mafrat performance can be traced back to innovations carried out by the suppliers, such as the introduction of a particular crumpled textile, coloured fabrics in layers, and rubberized jean.
Self-organization and emergence
The Mafrat SC is able to self-organize in short time. In fact, the supplier pool is frequently changed with a turnover both of new and outgoing suppliers equal to about 10%. The supplier selection process is rather short, covering a period of about 30 days and usually starts with a new collection development.
Similar characteristics are hold by the distribution network. The only difference is about the autonomy of the first-tier suppliers and first-tier distributors in the choice of their suppliers and customers. In fact, Mafrat keeps the control over the choice of the retailers by the first-tier distributors, whereas let free the first-tier suppliers to select their suppliers.
Adaptation
Mafrat is a leading company in its sector. In fact, it invests in continuous improvement and uses a proactive strategy on the market, without ever adopting imitative strategies.
Mafrat is characterized by a high volume and mix flexibility thanks to the outsourcing of the production to a great number of firms. The time to reconfigure their production cycle ranges from few minutes in case of little changes, such as for the accessorizes, to a few days in case of substantial changes, such as for the new manufactures.
Co-evolution
To asses the co-evolution property we focuses on the new product development process. It involves the following phases:
- Joint definition, between Mafrat and the firms holding the licensed brands, of the concept of the new collection;
- Supply of the materials/components needed to make the prototype;
- Making of the prototype in the Mafrat internal labs;
- Production of a number of collection books as much as the number of agents;
- Delivery of the collection books to the internal and external agents, to the buyers and to the showroom;
- Exhibition of the collection books to the retailers.
The entire time to market of the collection is about 4 months and the collection is totally new referring to the past one. Both suppliers and distributors are highly involved in the new product development. The former by giving suggestions on the use of new materials/components, the latter by providing information gathered by the retailers about the final customer needs.
To sum up, the co-evolution of the SC is quite high since all firms collaborate to develop the new collections using last update information on the customer needs.
Dynamic environment
The environment faced by Mafrat is characterized by low variability. In fact, consumer behaviours and needs change slowly, and changes in the competitive scenario and in the normative context are scarce.
The complexity of the Contempo supply chain
Variety of the elements
Figure 2 shows that the SC is made up of eight stages including the final customer. The Contempo (focal company) belongs to the assembly stage of the final product and it has three production sites localized one in the South of Italy, one in Romania, and the last in China. The supply network consists of three stages: the first-tier supply stage, formed by the components and the semi-finished product suppliers, the second-tier stage that consists of the worked raw material suppliers, and the third-tier stage formed by the raw material suppliers.
The distribution network consists of three stages: the first-tier stage includes the carriers, the second-tier stage formed by the wholesalers, and the third-tier by the retailers.
As the SC vertical complexity, the number of firms at the first-tier supply stage is about 60, including suppliers of polyurethane (2%), leather and fabric (34%), lining (2%), wood components (2%), bases (17%), mattresses (8%), table top (2%), packaging (2%), special components (25%), iron fittings (6%).
The second-tier suppliers and the raw material suppliers provide yarns for textile fibres, leather, woods, components for mattresses, steel, paper, special components and other materials.
The first distribution stage consists of three kinds of carriers: forwarding agents that move the 80% of the freights; shipping agents (19%); and shippers by air (1%).
The second level stage is formed by wholesalers, distinguished into buyer groups, retailer chains, and wholesalers. The buyer groups are formed by retailers and are mainly located in Italy and Europe. The retailer chains are international companies located in US and UK that manage hundreds of shops. The wholesalers are companies of the Contempo groups operating in Australia and US, which collect the customer orders.
The third level stage is made up of 6000 sales shops: 4% located in Italy, 50% in Europe, 33% in US and 13% in Australia.
Thus, the Contempo SC is characterized by a high vertical and horizontal variety and is not very geographically dispersed.
Agents with common schema
Across the SC, both in the supply and distribution network, the relationships are scarcely formalized, with very few reports and formal documentation circulating among companies. Each SC firm adopts its own system of performance measurements, although Contempo is integrated with its suppliers and distributors through an extranet-enabled extended Enterprise Resource Planning (ERP) software.
Connectivity
Figure 2 shows the types of links used along the SC. At the assembly stage, the horizontal links between Contempo and the foreign production sites in China and Romania are managed by Contempo, which plans their production process and control their inventory.
In the supply network, Contempo has established different kinds of links: in the first-tier stage it adopts managed links with suppliers of wood components and special components, it uses monitored links with the suppliers of polyurethane, leather, and fabric, and has not-managed links with suppliers of lining, bases, mattress, and iron fittings, table top, and packaging.
As to the second-tier and the raw material stages, all links are not-managed, except for those with the suppliers of wood and special components that are managed.
As to the distribution network, the links with carriers (first-tier distribution) are monitored in order to have updated information on the delivery dates and possible delays. The links with the second-tier distribution are monitored so as to collect information on the level of the customer satisfaction; the links with the retailers are not-managed, except for those with the Italian retailers and with retailers requiring shipping by air that are monitored.
Therefore, in the supply network there are mainly managed links, and in the distribution network monitored links.
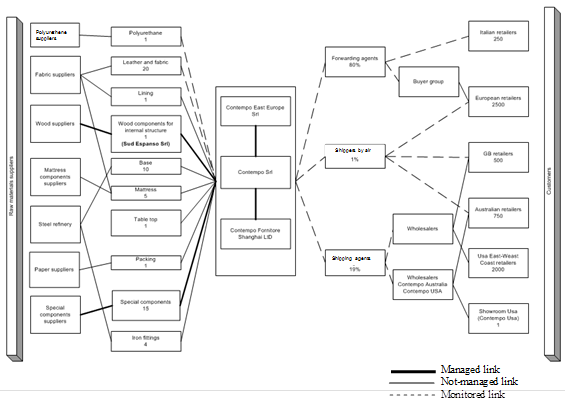
Figure 2: The Contempo supply chain.
In the supply and distribution networks, Contempo has mainly long-term relationships. The information sharing is high with suppliers. In particular, information about the inventory stock and delivery time is shared with a high frequency, since this information is critical to improve the reliability of the delivery. The level of information sharing with the distributors is low. Only the information on the sales forecast are frequently exchanged, in order to develop an accurate selling plan, whereas the information on customer satisfaction are shared only in the case of damages occurred during the transportation.
To sum up, the connectivity of the SC is high: the supply network is characterized by a higher connectivity than the distribution one.
Decentralized control
The Contempo SC is managed by using a decentralized decision making process. In fact, each actor in the SC makes its own decisions about the production plans, the inventory control, sales forecasting, etc.. Only in one case the decision making process is centralized. It refers to the supplier of the wood components whose production and purchasing plans are managed by Contempo. Moreover, the SC mechanisms to align incentives, such as revenue and cost sharing, are not used.
Non-linearity
Some unpredictable positive effects on the Contempo performance can be traced back to innovations carried out by the suppliers that have introduced the use of Internet portals in the order fulfilment process. Such an innovation improved the Contempo's performance by increasing the efficiency of the purchasing activities.
Self-organization and emergence
The Contempo SC is able to self-organize in short time. In fact, the supplier pool changes frequently with a turnover of both new and cancelled suppliers of about 10%. The supplier selection process is quite short: only few days are needed to search and select new suppliers that match the firm requirements. This time is longer only in the case of special components' suppliers, due to the complexity of these components.
The search of new suppliers is pushed by specific needs, such as the introduction of new materials and components used to develop new products or improved the comfort and quality of the existing ones.
As to the distribution network, the turnover is about 5% for the new distributors and about 15% for the outgoing ones. The distribution pool is quite static since the focal company aimed at keeping and strengthening the actual market share rather than entering in new markets.
The autonomy of both suppliers and distributors in the choice of their suppliers and customers is high. However, Contempo intends to intervene in the choice of its first--tier suppliers in order to improve the product quality and reliability.
Adaptation
Contempo is not a leader company in its sector, thus it tends to adopt a "follower strategy", and imitates its main competitors in terms of new materials, new design, and new distribution channels.
Contempo has a relatively high level of mix flexibility but low level of volume flexibility. The time to reconfigure the production cycle is long due to the complexity of the product and can takes some weeks.
Co-evolution
The level of co-evolution of the SC is quite high. The new product development has a short time to market that takes less than 2 months. Every year new collections are developed including both new models and models of the past collections. New models are developed on the basis of information on the customer satisfaction about the comfort, market analyses, and the creativity and the experience of the entrepreneur and its design team.
Suppliers and distributors are highly involved in the new product development process. The former co-design the new products with Contempo and participate in projects for continuous improvement, the latter share information on the needs of the final customer.
Dynamic environment*
The environment is characterized by a low variability. In fact, the consumer behaviors and needs change with a relatively low frequency and changes in the competitive scenario and in the normative context are rare.
Summary
The key results of the within-case analyses of the two SCs are presented in Table 5.
| CAS properties | Mafrat SC | Contempo SC |
|---|---|---|
| Variety of Elements | - High vertical variety - High horizontal variety - High spatial variety | - High vertical variety - High horizontal variety - Low spatial variety |
| Agents with common schema | - Scarcely formalized relationships | - Scarcely formalized relationships |
| Connectivity | - Supply network: mainly not managed links - Distribution network: mainly managed links - Mainly long-term relationship - High information sharing | - Assembly stage: managed links - Supply network: managed links - Distribution network: mainly monitored links |
| Decentralized control | - Decentralized decision making process along the SC - Decision making centralized by the focal company to manage the first-tier suppliers | - Decentralized decision making process along the SC |
| Non-linearity | - Unpredictable positive effects on the focal company performance due to innovations carried out by suppliers | - Unpredictable positive effects on the focal company performance due to innovations carried out by suppliers |
| Self-organization and emergence | - High turnover of suppliers and distributors - Short time of search and selection of new suppliers - First-tier suppliers are autonomous in the choice of their suppliers - The focal company controls the first-tier distributors in the choice of their customers | - High turnover of suppliers and distributors - Short time of search and selection of new suppliers - The focal company tends to control the first-tier suppliers in the choice of their suppliers - First-tier distributors are autonomous in the choice of their customers |
| Adaptation | - High volume and mix flexibility - The time to reconfigure the production cycle ranges from few minutes to a few days - Low frequency of production re-scheduling | - Moderate mix flexibility but and low volume flexibility - Long time to reconfigure the production cycle - High frequency of production re-scheduling |
| Co-evolution | - Short time to market and high frequency of new product development - New products are developed on the basis of actual data on the customer needs - Suppliers and distributors are very fully involved in the new product development | - Short time to market and high frequency of new product development - New products are developed on the basis of the past experience of the design team and on historical data - Suppliers and distributors are fully involved in the new product development |
| Dynamic environment | - Environment characterized by low variability | - Environment characterized by low variability |
Table 5: Summary of within-case data.
Cross-cases analysis
The SCs are compared in terms of CAS properties in order to identify similarities and differences in their structure. The aim of the cross-case analysis is to identify specific patterns linking some strategic characteristics of the SC (the type of product, the length of the product life cycle, and the SC competitive priorities) with the value of the SC complexity features. By the cross-case analysis, we develop a set of theoretical propositions that relate the SCs' strategic features with different level of complexity. In particular, we suggest how to shape the complexity of a SC under specific strategic features. Table 6 characterizes the two SCs based on three relevant strategic features.
| Supply chains | Product | Product life cycle | Competitive priority |
|---|---|---|---|
| Mafrat SC | Low complex | Short | Service level |
| Contempo SC | High complex | Long | Product quality |
Table 6: Strategic features characterizing Mafrat and Contempo SCs.
Variety of the elements
We compare the horizontal complexity, the vertical complexity, and the geographical dispersion of the two SCs.
As to the horizontal complexity, the SCs are rather similar. The main difference is that Mafrat outsources the production activities to external firms while Contempo holds three production sites. Thus, Mafrat is less vertically integrated in the upstream than Contempo, while it is more vertically integrated in the downstream supply chain given that it owns two firms involved in the distribution stage.
As to the vertical complexity, the Mafrat supply network is more complex since it involves a great number of suppliers. This is due to the simplicity of the product made up of standard items that can be supplied by many suppliers. Thus, Mafrat adopts a multiple sourcing policy as supply strategy.
The product of Contempo is more complex both in terms of number of components and product technology. Thus, Contempo prefers to establish collaborative relationships with a small number of selected suppliers.
Thus, we formulate the following proposition:
P1. The lower is the complexity of the product carried out through a SC, the higher is the vertical complexity of the supply network.
As to the geographical dispersion, due to the different level of complexity between the products, the supply network of Mafrat is characterized by a high level of dispersion (40%), whereas Contempo mainly resorts to suppliers located within the local area, thus its supply network is very geographically bounded (7%). The level of dispersion of the distribution network is mainly influenced by the wideness of the market of the firm. As a result, the Contempo distribution network is less dispersed (45%) than the Mafrat one (60%).
Thus, the following proposition is derived:
P2. The lower is the complexity of the products carried out through a SC, the wider is the supply network geographical spread. *
Connectivity
Different levels of connectivity characterize the SC of the two firms. We found that not-managed links are in the majority in the supply network of Mafrat and in the distribution network of Contempo. On the contrary, in the distribution network of Mafrat and in the supply network of Contempo there are mainly managed and monitored links. Coherently, the information sharing across the SC is wide for Mafrat in the distribution network and for Contempo in the supply network. This can be explained by the different length of the product life-cycle, which is shorter for Mafrat (about 6 months) than for Contempo (in average 1 year but longer in case of successful models). In fact, a short life-cycle requires a stronger control of the final market ensured by the agents of the distribution network. A longer life-cycle requires to focus on different performances, such as the continuous improvement of the product quality and the cost reduction. These performances can be achieved by managed and collaborative relationships with suppliers.
Thus, we elaborate the following propositions:
P3. SCs that produce products with short life-cycle are more likely to have distribution network with managed links.
P4. SCs that produce products with long life-cycle are more likely to have supply network with managed links.
Self-organization and emergence
Both SCs are characterized by a high degree of re-configuration as shown by the high turnover of the suppliers and the distributors, and the short time of search and selection of new suppliers. However, some differences can be highlighted. In the case of Mafrat the first-tier suppliers are autonomous in the choice of their suppliers, whereas for the first-tier distributors the choice of their customer is completely controlled by Mafrat. In the case of Contempo, although all the first-tier suppliers and distributors are autonomous in their choices, there is the will of controlling suppliers in their choices.
This behaviour reflects the two different competitive priorities of Mafrat and Contempo. The former pursues the efficacy through the increase of the service level, the latter pursues the efficiency through the increase of the product quality.
Thus, the following propositions are formulated:
P5. SCs having the service level as competitive priority are more likely to have a self-organized supply network and a controlled distribution network.
P6. SCs having the product quality as competitive priority are more likely to have a self-organized distribution network and a controlled supply network.
Co-evolution
We found that both SCs co-evolve with the external environment. In fact, the new product development process takes short time, new collections are frequently developed, and both suppliers and distributors collaborate in the process.
However, a significant difference is highlighted in the criteria adopted to develop the new collections. Mafrat relies on actual data on the customer needs gathered through market analysis and information coming from distributions; Contempo mainly develops the new models on the basis of the past experience of the design team and on historical data.
Thus, we derive the following propositions:
P7. SCs having the service level as competitive priority are more likely to have a market-pull new product development process, while SCs having the product quality as competitive priority are more likely to have a technology-push new product development process.
Conclusions
This paper deals with a very challenging topic in the supply chain management, namely the assessment of the SC complexity.
Borrowing from theory on CASs, we built a framework identifying the main CAS properties and associated them with features characterizing the SC. In so doing, we proposed a more comprehensive tool to assess the SC complexity. The latter was referred not only to the variety of elements characterizing the SC and the links among the members - factors usually recognized as source of complexity in SC - but included further properties of CASs, such as agents with common schema, non linearity, self-organization and emergence, adaptation, co-evolution, and dynamic environment.
Two case studies were also carried out to test the application of the proposed framework to real SCs and to analyze how diverse SCs, in terms of products and competitive priorities, cope with complexity. To do this, we developed a questionnaire with quantitative and qualitative measures to adopt when assessing SC complexity, which is a further practical contribution of our paper.
Finally, we compared the two examined SCs through the complexity dimensions proposed by our framework. The resulting analysis identified similar behaviors and diverging ones, permitting us to develop interesting theoretical propositions, which can inform the future research on the topic and can be used to derive managerial guidelines for the management of the SCs as CASs.
We recognize that the main limit of our study is due to the possibility to generalize these managerial guidelines because they are based on two case studies. However, the approach we used that consists in considering the SC as a CAS, permit us to think these results valid in any SC with the same strategic variables, no matter the sectors to which the SC belongs.
Footnote
References
Axelrod, R. and Cohen, M.D. (1999). Harnessing Complexity: Organizational Implications of a Scientific Frontier, ISBN 9780465005505.
Baldwin, C.Y. and Clark, K.B. (1997). "Managing in an age of modularity," Harvard Business Review, ISSN 0017-8012, Sept/Oct: 81-93.
Bozart, C.C., Warsing, D.P., Flynn, B.B., and Flynn, E.J. (2009). "The impact of supply chain complexity on manufacturing plant performance," Journal of Operations Management, ISSN 0272-6963, 27(1): 78-93.
Cachon, G.P. (2003). "Supply coordination with contracts," in S.C. Graves and A.G. de Kok (eds.), Handbooks in Operations Research and Management Science, ISBN 9780444513281, pp. 227-339.
Carbonara, N., Giannoccaro, I., and Pontrandolfo, P. (2002). "Supply chains within industrial districts: a theoretical framework," International Journal of Production Economics, ISSN 0925-5273, 76(2): 159-176.
Casti, J.L. (1997). Would-Be Worlds: How Simulation is Changing the Frontiers of Science, ISBN 9780471123088.
Chidamber, S.R. and Kon, H.B. (1994). "A research retrospective of innovation inception and success: the technology-push, demand-pull question," International Journal of Technology Management, ISSN 0267-5730, 9(1): 94-112.
Choi, T.Y., Dooley, K.J., and Rungtusanatham, M. (2001). "Supply networks and complex adaptive systems: control versus emergence," Journal of Operations Management, ISSN 0272-6963, 19: 351-366.
Choi, T.Y. and Hong, Y. (2002). "Unveiling the structure of supply networks: case studies in Honda, Acura, and Daimler-Chrysler," Journal of Operations Management, ISSN 0272-6963, 20: 469-493
Choi, T.Y. and Krause, D.R. (2006). "The supply base and its complexity: Implications for transaction costs, risks, responsiveness, and innovation," Journal of Operations Management, ISSN 0272-6963, 24: 637-652.
Choi, T.Y., Rungtusanatham, M., and Wu, Z. (2010). "Supplier-supplier relationships in buyer-supplier-supplier triads: Implications for supplier performance," Journal of Operations Management, ISSN 0272-6963, 28: 115-123.
Choi, T.Y., Wu, Z., Ellram, L., and Koka, B.R. (2002). "Supplier-supplier relationships and their implications for buyer-supplier relationships," IEEE Transactions on Engineering Management, ISSN 0018-9391, 49(2): 119-130.
Cooper, M.C. and Lambert, D.M. (2000). "Issues in supply chain management," Industrial Marketing Management, ISSN 0019-8501, 29: 65-83.
Cooper, M.C., Lambert, D.M., and Pagh, J.D. (1998). "Supply chain management: Implementation issues and research opportunities," The International Journal of Logistics Management, ISSN 0957-4093, 9(2): 1-19.
Cooper, M.C., Lambert, D.M., and Pagh, J.D. (1997). "Supply chain management: More than a new name for logistics," The International Journal of Logistics Management, ISSN 0957-4093, 8(1): 1-13.
Dooley, K.J. (1997). "A complex adaptive systems model of organization change," Nonlinear Dynamics, Psychology, and Life Sciences, ISSN 1090-0578, 1(1): 69-97.
Gauvin, S. and Sinha, R.K. (1993). "Innovativeness in industrial organizations: a two-stage model of adoption." International Journal of Research in Marketing, ISSN 01678116, 10: 165-183.
Gell-Mann, M. (1994). The Quark and the Jaguar, ISBN 9780805072532.
Giannoccaro, I. and Pontrandolfo, P. (2003). "The organizational perspective in supply chain management: an empirical analysis in Southern Italy," International Journal of Logistics Research and Applications, ISSN 1469-848X, 6(3): 107-123.
Giannoccaro, I. and Pontrandolfo, P. (2004). "Supply chain coordination by revenue sharing contracts," International Journal of Production Economics, ISSN 0925-5273, 89(2): 131-139.
Goldstein, J. (1999). "Emergence as a construct: History and issues," Emergence, ISSN 1521-3250, 1: 49-72.
Harrigan, K.R. (1985). "Vertical integration and corporate strategy," Academy of Management Journal, ISSN 0001-4273, 28(2): 397-425.
Holland, J.H. (1995). Hidden Order: How Adaptation Builds Complexity, ISBN 9780201442304.
Hult, G.T.M., Ketchen, D.J., and Slater, S.F. (2004). "Information processing, knowledge development, and strategic supply chain performance," Academy of Management Journal, ISSN 0001-4273, 47: 241-253.
Kauffman, S.A. (1993). The Origins of Orders: Self-Organization and Selection in Evolution, ISBN 9780195079517.
Lane, D. (2002). "Complexity and local interactions: Towards a theory of industrial districts, complexity and industrial districts," in: A.Q. Curzio and M. Fortis (eds.), Complexity and Industrial Clusters: Dynamics and Models in Theory and Practice, ISBN 9783790814712.
Lee H.L. (2004). "The Triple - A supply chain," Harvard Business Review, ISSN 0017-8012, 83: 102-112.
Lee H.L., Padmanabhan V., and Whang S. (1997). "The bullwhip effect in supply chains," Sloan Management Review, ISSN 1532-9194, 38(3): 93-102.
Mahapatra, S.K., Narasimhan, R., and Barbieri, P. (2010). "Strategic interdependence, governance effectiveness and supplier performance: A dyadic case study investigation and theory development," Journal of Operations Management, ISSN 0272-6963, 28(6): 537-552.
Mitleton-Kelly, E. (ed.) (2003). Complex Systems and Evolutionary Perspectives of Organizations: The Application Of Complexity Theory to Organizations, ISBN 9780080439570.
Narayanan, V.G. and Raman, A. (2004). "Aligning incentives in supply chains," Harvard Business Review, ISSN 0017-8012, 83: 94-102.
Pathak, S.D., Day, J.M., Nair A., Sawaya, W.J., and Kristal, M.M. (2007). "Complexity and adaptivity in supply networks: Building supply network theory using a complex adaptive systems perspective," Decision Sciences, Online ISSN 1540-5915, 38(4): 547-580.
Perona, M. and Miragliotta, G. (2004). "Complexity management and supply chain performance assessment. A field study and a conceptual framework," International Journal of Production Economics, ISSN 0925-5273, 90: 103-115.
Sammarra, A. and Belussi, F. (2006). "Evolution and relocation in fashion-led Italian districts: evidence from two case-studies," Entrepreneurship & Regional Development, ISSN 0898-5626, 18: 543-562.
Simchi-Levi D., Kaminsky P., and Simchi-Levi E. (2002). Designing and Managing the Supply Chain: Concepts, Strategies and Case Studies, ISBN 9780256261684.
Stock, G.N., Greis, N.P., and Kasarda, J.D. (2000). "Enterprise logistics and supply chain structure: The role of fit," Journal of Operations Management, ISSN 0272-6963, 18: 531-547.
Surana, A., Kumara, S., Greaves, M., and Raghavan, U.N. (2005). "Supply-chain networks: a complex adaptive systems perspective," International Journal of Production Research, ISSN 1366-588X, 20: 4235-4265.
Towill, D. (1996). "Industrial dynamics modeling of supply chains," Logistics Information Management, ISSN 0957-6053, 9: 43-56.
Tsay, A.A. (1999). "The quantity flexibility contract and supplier-customer incentives," Management Science, ISSN 0025-1909, 45(10): 1339-1358.
Vickery, S., Calantone, R., and Droge, C. (1999). "Supply chain flexibility: an empirical study," Journal of Supply Chain Management, ISSN 1745-493X, 35(3):16-24.
Wu, Z and Choi, T.Y. (2005). "Supplier-supplier relationships in the buyer-supplier triad: building theories from eight case studies," Journal of Operations Management, ISSN 0272-6963, 24 (1): 27-52.
Yin, R.K. (1984). Case Study Research: Design and Methods, ISBN 9780803956629.