Introduction
The question that we want to explore in this paper is how change really occurs in socio-economic systems, based on the ideas of ‘evolutionary drive’ put forward some years ago (Allen & McGlade, 1987). In this view the evolutionary process is driven by the interplay of processes that create micro-diversity, and the selection operated by the differential dynamics that occurs in the system. This is seen as a continuous, ongoing process and not one that has already “run its course” (Maynard-Smith, 1979). We do not see the behavioral evolution of interacting people, and in particular their coevolution, as being over and therefore ‘optimal’ as in the Game Theory approach of Evolutionary Stable Strategies, but instead as an ongoing process that is occurring in real time, and which involves innovations and qualitative changes of various kinds. History is still running. Each behavioral type is in interaction with others, and therefore evolutionary improvements may lead to greater synergy or conflict between behaviors, and in turn lead to a chain of responses without any obvious end. And if there is no end, then the most that can be said of the behavior of any particular individual or population is that its continued existence proves only that it is, and has been, sufficiently effective—but not that it is optimal.
Our aim here is to show how the underlying mechanisms of evolution involve micro-diversity within a system, and how this drives an evolving, emergent system structure that is characterized by a changing level of structural diversity. It also explains exaptation (Gould & Vrba, 1982; Gould, 2002) since the micro-diversity pre-exists the ‘uses’ and ‘niches’ that they later embody. This will take into account both the ‘selective’ effects of interactions between species, and the simultaneous mechanism that discovers new ‘strategies’ or ‘niches’. In Darwinian thinking the micro-diversity that occurs is considered to be ‘random’ and independent of the selection processes that follow, while in human innovation we may think that there is intention, calculation and belief that may ‘channel’ diversity into some narrower range.
Diversity is a measure of the number of qualitatively different types of entity present corresponding to individuals with different attributes. It may be that they share some dimensions, but differ on others. This is an important point because it refers to a fundamental issue for evolution—that it concerns the qualitative changes that occur in systems and structures over time. This also introduces another important issue: multiple levels of description. In evolutionary systems, the internal nature of the interacting individual entities changes over time, as does the configuration of the interactions between these types, leading to a changing overall system performance within its environment. This presents us with a view in which individuals are bundles of their internal components. The local community, or organizations, they form are bundles of these individual types. The ecosystems and larger structures they form are bundles of these local communities. The essential feature is that of the coevolution of successive layers of interacting elements both horizontally and between levels. The diversity of the different levels of structure arises through these coevolutionary processes, which are in turn driven by the generation of micro-diversity—diversity at the level below. To illustrate this, let us consider the simplest possible example. Let us consider how a population evolves. It evolves if new behavior both invades a population and also grows to a significant level in the system.
Micro-diversity: The basis of evolutionary drive
The dialogue between population dynamics—the simple reduced model of an ecosystem—and mutations or innovations, is particularly interesting in that it gives rise to what is usually referred to as evolutionary ecology.
Evolution of populations
Consider as an example, the simplest possible ecosystem: a single species growing according to the logistic equation,
This equation, describing the growth of a species x in a system with limited resources has a stable, stationary state, x0=N(1-m/b.One approach to the question of how evolution occurs, in a reflection at this high level of populations, is to ask what new behavior could invade the stationary state of equation (1). Let us consider the effect of an individual x that explores the pay-off to be had for a new behavior—that of a ‘mutant’, x'. The new behavior competes with x to an extent ß for the limiting resource N (0 < ß < 1). The mutant is characterized by some other birth rate b' and death rate mx', and the system equations become:
Now we ask whether or not the pay-off for x' is positive. If so it will invade the system. This question is decided by testing the stability of the pre-existing state, x' = N (1—m/b); x' = 0. If it is stable, then x cannot invade the system. If it is unstable, invasion can proceed.
A simple stability analysis shows that the condition for x' to invade is:
N' (1—m'/b') > ß(N [1—m/b] (3)
When this condition is fulfilled, x' will grow. Thus, if we supposed that different mutants are produced by some microscopic mechanisms, with randomly scattered values of b', m' and N' then only those mutants whose parameters satisfied condition (3) can ‘invade’ and grow in the system. It would reject all the others.
Hence, as a result of random mutations, evolution within a given ‘niche’ ( ß = 1) will lead to increased ‘exploitation’, or increasingly efficient use of the resources. The important point in this case is that, the condition that allows x' to grow also ensures that x must decrease and disappear, as portrayed in Figure 1a.
When overlap is not total, ß < 1, invasion is easier, since the value of N' (1—m'/b') need not be as high. What we shall observe, therefore, in a system with limited resources is that over a long period of time an initially empty resource spectrum will gradually be filled by different populations (Figure 1b) each adapted to a certain range of resources. Also, within any particular range or type of resource the efficiency of exploitation will increase irreversibly. This result can be extended to situations where genetics are explicitly considered, but these slightly more complicated equations do not lead to a different qualitative result.
This approach can be generalized Allen (1976). If we suppose that n species are interacting according to some general dynamic equations, then the conditions for ‘invadability’ by new, randomly produced mutants lead to the general equation:
Stability Matrix of Whole = {Stability Matrix of Old} x (Stability Matrix of New} (4)
But because the old system is at a stable stationary state, if an evolutionary step is to occur, then it can result only from the existence of a positive root of the stability matrix for the new populations - evaluated at the existing stationary state, and xn + 1, xn + 2,... = 0. This is general result has been applied to several different ecological systems (e.g., Allen, 1976, 1984). One interesting case is the calculation of the total population diversity of Darwin’s Finches that will occupy different sized islands in the Galapagos. These islands are home to some 14 species of finch, which are generally not found elsewhere, and different sized groups or ‘bundles’ of finch fill different sized islands (Lacks, 1947).
a)?Within?the?same?“niche”,?we?find?successive?replacement?by?more?“effective”?populations,?b)?A?resource?spectrum?will?fill?by?different?populations
This shows us that equation (4) can be used to make some ‘predictions’ about evolution, and although we cannot predict precisely which ‘species’ will occupy a given set of resources, we can nevertheless anticipate the total amount of diversity that will be found there. We can link resource volume, environmental fluctuation (May, 1973), and morphological diversity and ‘predict’ the volume of niches available to different populations, assuming the structural stability of the overall ecology. In other words, evolution leads to a given amount of ‘coherent’ diversity. As an example, Table 1 shows the actual total variance in beak measurements (in mms) for the particular species that inhabit that island. But, the motor that drives this evolutionary filling of niches is actually that of micro-diversity generation - diversity produced at the level below that of the ecosystem.
Evolution as the result of micro-diversity
Having used macroscopic equations of population dynamics to explore how evolution occurs, we can look at the production of deviant behaviors, of ‘potential exaptations’, and examine how the system will evolve as a result.
Let us now consider the workings of this ‘micro-diversity’ and see how it both drives evolution - and is also selected for by evolution.
Equation (5) expresses the outward diffusion of populations from any particular type, and their amplification or suppression according to their b/m parameters through selection. Let us consider the logistic equation and a ‘population character space’ of different possible behaviors for the population x. If we consider that initially we have a single ‘pure’ population type then it will sit on one particular behavior, i. However, if there are any ‘errors’ or ‘explorations’ made in the reproduction of this behavior, then over time this will correspond to diffusion outwards in that space - to the generation of micro-diversity. So,
(1—f ) xi flow from behavior i to i+1 and i-1;
0.5 (1—f ) Vxi + 1 flow from i+1 into i;
0.5 (1—f ) Vxi—1 flow from i-1 into i.
? represents the fraction of explorations that are viable. The first term corresponds to ‘normal’ reproduction, the second and third to the production of micro-diversity. The assumption is made, however, that the diversity merely results in a distribution of birth and death rates.
This experiment tells us that the population increases in fitness - climbs the hill - because
Table?1
The relationship found between beak diversity and resource volume for the transitional vegetation found on all the islands (Bowman, 1961).
In a second experiment we can examine how much diversity creation (error-making) wins in the discovery of better performance. In this experiment we launch two populations simultaneously at the foot of the fitness hill, and see how successfully they climb it. Here population 1 is assumed to have a 5% exploration rate in character space, while population 2 has 10%. However, we also make the assumption that of these ‘random’ experiments, only 2% are actually viable, which means that there is a considerable ‘opportunity’ cost in exploring rather than making perfect copies. Initially, population 2 wins, because, despite its cost in non-viable individuals, diffusing faster is rewarded by the fitness slope but later when the hill is climbed, faster diffusion is no longer rewarded and population 1 dominates. This sequence of events is shown in Figure 3.
Micro-diversity?production?will?lead?to?many?non-viable?types,?but?still?the?population?will?evolve?greater?fitness?and?climb?the?fitness?landscape
If?we?have?two?populations?that?have?different?rates?of?‘exploration’?then?we?find?that?the?relative?success?changes?from?early?exploration?to?late?exploitation
Our model shows that when we are in a new domain, and there is much to learn—then high rates of exploration pay off. However, when we are in a mature system that has already been thoroughly explored there is no point wasting effort on further exploration. This is something like an r to K switch in ecology, but our model is generating it endogenously. Of course, we can only know that there are opportunities, or not, by actually engaging in exploration, but clearly, unless there is some structural change, the value of exploration falls with sector maturity, and this will cause exploration behavior to switch to exploitation.
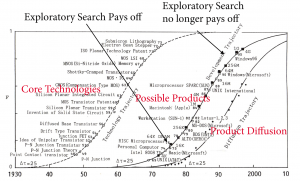
In human systems, the typical development of economic sectors and markets, as shown in the work of Hirooka (2006) (see Figure 4), both expresses and results from the fact that initially search is rewarded—the bundling of components attracts investments. However, as the sector becomes well-established the pay-offs to new types of products falls, and so investment falls. It then switches to some other area that may seem to offer better opportunities. This is exactly what our simple theoretical model above predicts.
The presence of firms with different levels of exploration and exploitation (error-making and accuracy) will automatically lead to evolution selecting whichever is most appropriate. So, evolution will be driven by the amount of diversity generation to which it leads. Evolution selects for an appropriate capacity to evolve, and this will be governed by the balance between the costs of experimental ‘failures’ (the non-viable individuals created) and the improved performance capabilities discovered by the exploration. This is what holds ‘total diversity generation’ in check.
The?evolution?of?any?industrial?sector?(here?consumer?electronics)?may?be?explained?by?a?similar?dynamics,?where?investment?gradually?switches?from?exploration?to?exploitation
From Hirooka (2006).
Complexity and evolutionary drive
Having examined the simple examples of the previous section we find a clear outcome. ‘Evolutionary drive’ tells us that evolution is driven by the noise to which it leads. Providing that microscopic diversity (noise) is produced in systems of interacting populations, the dynamics resulting from the interactions will lead to the retention and amplification of some, and the suppression of others. Not only that, the selection process operated by the ‘level above’ will automatically select for individuals and groups that retain the ability to create micro-diversity. This process will select for evolvability as well as for particular types of micro-diversity at a given time. We may remark in passing that this means that there will never be a completely clear understanding of any evolving system at a given time, because it will always contain micro-diverse elements that may or may not turn out to be successful. The understanding that we can have of reality is obtained by creating a ‘system’ of interacting entities that are sufficiently correct to describe the current situation, but inadequate to predict the future structural evolution that may occur.
We understand situations by making creative, but simplifying assumptions. We define the domain in question (the boundary) and by establishing some rules of classification (a dictionary) that allow us to say what things were present when. This means that we describe things strategically in terms of words that stand for classes of object. The ‘evolutionary tree’ is an abstraction concerning types of thing rather than things themselves. In order to go further in our thinking, and get more information about an actual situation, we then consider only the present, and say, what is this system made of now, and how is it operating now. This is ‘operational’ not strategic. It therefore assumes structural stability and takes us away from open, evolutionary change, to the effects of running a fixed set of processes. If the events considered are discreet, then the running is according to a probabilistic dynamics, and we have what is called stochastic nonlinear dynamics, where different regimes of operation are possible, but the underlying elements never change nor learn, nor tire of their behaviors. If we assume that we can use average
Table?2
The general complexity framework.
Table 2 sets out the kind of models that result from a particular set of assumptions.
This succession of models arises from making successive, simplifying assumptions, and therefore models on the right are increasingly easy to understand and picture, but increasingly far from reality. The operation of a mechanical system may be easy to understand, but that simplicity has assumed away the more complex sources of its ability to adapt and change. A mechanical model is more like a ‘description’ of the system at a particular moment, but does not contain the magic ingredient of micro-diversity that constitutes ‘evolutionary drive’. The capacity to evolve is generated by the behaviors that are averaged by assumptions 3 and 4—average types and average events—and therefore organizations, or individuals, that can adapt and transform themselves, do so as a result of the generation of micro-diversity and the interactions with micro-contextualities. This tells us the difference between a reality that is ‘becoming’ and our simplified understanding of this that is merely ‘being’ (Prigogine, 1981).
The complexity matrix
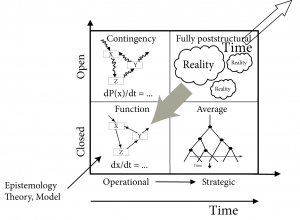
All systems that emerge, persist and wish to grow must deal with the fact that by their present actions they must attract resources, and they must also change their actions to fit into the future. In this connection we can re-write our deconstruction of complexity on a two by two matrix that looks at the short and the long term, and at the closed and open nature of the dimensions considered. The matrix is shown in Figure 5.
Lower left quadrant: The model
This quadrant contains a mechanical view of the system and is a structurally fixed system that functions on the basis of certain fixed assumptions about the environment. So, it assumes, for example, that the input resources are available as required at a given cost, and that customers will buy the production at a given price. It assumes that employees will have the appropriate skills and will work at the wage levels provided, and it assumes that the machines, the power supply, the waste disposal, water supply, etc. all function without problems. If all these elements could be guaranteed constant and uninterrupted, then the process could be ‘tuned’ to peak efficiency, and minimum cost. Unfortunately, this guarantee cannot be given, and in addition, the resources, technologies, customers and competitors will all be subject to change over time. In the short term, we will have the response of the overall manager to the fact that the business is open to the environment.
Upper left quadrant: Contingency
In reality, in the short term, there are still a series of factors that come from outside the closed set of routines and processes defining the business and that can affect the smooth running of the business process. So, the upper left quadrant shows us that the prudent manager needs to allow for ‘contingency’ and for dealing with breakages, wear and tear, accidents and possible problems with resources, or with the customers for the activities of the system. Clearly, breakdowns, flu epidemics, fires and weather problems can and will arise with a certain probability, and the models constructed in this quadrant can be used to deal with these contingencies. However, there will always be events or circumstances that cannot be foreseen, and which do not have a probabilistic representation.
The?Complexity?Matrix?expresses?our?different?understandings?of?the?system?in?each?quadrant
Lower right quadrant: Strategic analysis
In the lower right quadrant, we have a strategic ‘sense-making’ of what has happened. It is about the evolution of the business, and of the sector in which it has evolved. A picture of the past can be drawn, in which key innovations can perhaps be identified and the ‘future direction’ of the products and of the business organization can also be reflected upon. This lower right quadrant is a potential source of wisdom, since it looks at history and tries to make sense of it, identifying strategic trends and directions in which innovation and developments should be aimed.
Upper right quadrant: Exploration
This is the quadrant of undiluted reality. It does not assume that stable variables can be identified and that a model of any persistence can be usefully developed. It is the domain where soft-systems thinking and post-modernism exist, and where practitioners simply attempt to use their intuitive and improvising skills to get by. This is the domain where the work of Stacey on complex responsive processes exists. Equally, action and participatory research inhabit this quadrant, where knowledge is not the aim, but action is. An important point however, is that there can still be important parts of reality that do operate in a sufficiently coherent way for some time, and so modeling and exploration of nonlinear systems, and possible evolution, can still provide important information for the more open, improvised behaviors found in real systems. The mechanism of ‘evolutionary drive’ that underpins change in biological and ecological systems will be shown to be a valid model for understanding human evolution as well.
Modeling human systems
Behaviors, practices, routines and technologies are invented, learned and transmitted over time between successive actors and firms, and we shall discuss how the principles of ‘evolutionary drive’ can be used to understand them as well in human systems as in the biological.
A fisheries example
A detailed model was developed of Canadian Atlantic fisheries (Allen & McGlade, 1987; Allen, 1994, 2000). This consists of a spatial model with 40 zones over which up to eight fleets of fishermen roam, attempting to make a living by finding and catching different fish populations. The fishermen’s movements are informed by their ‘mental maps’ of potential profit, and this is based on the information they have from other fishermen. Clearly, members of their own fleet will exchange information, but this may not be true for other fleets. The model therefore describes fishing as a result of the acquisition and exploitation of knowledge about where profits are being made by other fishermen. This means that there is a spatial positive feedback mechanism that structures fishing patterns. Of course, in deciding which zone to go to, fishermen take into account the distances involved to go there, and to return to port and the cost of fuel.
In addition to these effects, however, our equation takes another very important factor into account. This factor R expresses how ‘rationally’, how ‘homogeneously’ or with what probability a particular skipper will respond to the information he is receiving. For example, if R is small, then whatever the ‘real’ attraction of a zone i, the probability of going to any zone is roughly the same. In other words, ‘information’ is largely disregarded, and movement is ‘random’. We have called this type of skipper a Stochast. Alternatively, if R is large it means that even the smallest difference in the attraction of several zones will result in every skipper of that fleet going, with probability 1, to the most attractive zone. In other words, such deciders put complete faith in the information they have, and do not ‘risk’ moving outside of what they know. These ‘ultra rationalists’ we have called Cartesians. The movement of the boats around the system is generated by the difference at a given time between the number of boats that would like to be in the each zone, compared to the number that actually are there. As the boats congregate in particular locations of high catch, so they fish out the fish population that originally attracted them. They must then move on the next zone that attracts them, and in this way there is a continuing dynamic evolution of fish populations and of the pattern of fishing effort.
Running these fishery simulation models shows us that it is not true that fleets seeking profit with the highest possible economic rationality win. Indeed, the models show that it is important not to seek profit too ardently. Profit is actually generated by behavior that does not seek profit maximally!
This is because in order to fish for any length of time it will be necessary not only to exploit current information about fish stocks, but to generate new, currently unknown fish stocks, and exploit them. So exploitation alone is inadequate and some mix of exploration and exploitation are required. This tells us that the ability to learn is more important over time, than the ability to exploit efficiently. Essentially it means that there has to be exploration and then a selection using the new information generated by the exploration. Just as in the biological model discussed above, humans require to generate micro-diversity in their knowledge, and then make decisions based on the positive pieces of information, while being careful not to continue with exploratory behavior. This model also shows us that there is no such thing as an ‘optimal strategy’. As soon as any particular strategy becomes dominant in the system, then it will always be vulnerable to the invasion of some other strategy. More importantly, we see that the knowledge generation of fleets arise from their ability and willingness to explore. So, instead of this corresponding to ultra efficiency and rationality, it actually arises from the opposite—a lower level of rationality, and a freedom to take creative action.
Emergent market structure
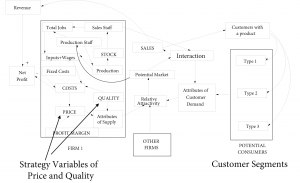
The ideas developed in the sections above can also show us how important dynamic capabilities are for firms in the market place. Here we see how these dynamic capabilities are what is responsible for structuring of economic markets, as competition creates ecologies of firms, creating and filling interacting market niches. The fundamental process can be explored initially using a simple model in which we consider the possible growth/decline of several firms that are attempting to produce and sell goods on the same market. The potential customers of course will see the different products according to their particular desires and needs, and in the simple case examined here, we shall simply consider that customers are differentiated by their revenue, and therefore have different sensitivities to price.
The structure of each firm that is modeled is as shown in Figure 6. Inputs and labor are necessary for production, and the cost of these added to the fixed and start-up costs, produce goods that are sold by sales staff who must ‘interact’ with potential customers in order to turn them into actual customers. The potential market for a product is related to its qualities and price, and although in this simple case we have assumed that customers all like the same qualities, they have a different response to the price charged. The price charged is made up of the cost of production (variable cost) to which is added a mark-up. The mark-up needs to be such that it will turn out to cover the fixed and start-up costs as well as the sales staff wages. Depending on the quality and price, therefore, there are different sized potential markets coming from the different customer segments.
A?model?of?6?interacting?firms/agents?whose?choice?of?mark-up?and?quality?represent?their?strategies
When customers buy a product, they cease to be potential customers for a time that is related to the lifetime of the product. For high quality goods this may be longer than for low quality, but of course, many goods are bought in order to follow fashion and style rather than through absolute necessity. Indeed, different strategies would be required depending on whether or not this is the case, and so this is one of the many explorations that can be made with the model.
The model calculates the relative attractivity of a product (of given quality and price) for a customer of a given type (poor, medium or rich). This results in a calculation of the ‘potential market’ for each firm at each moment, and the sales staff must interact with these potential customers in order to turn them into customers. When a sale is made, then the potential customer becomes a customer and disappears from the market for a time that depends on the product lifetime. The revenue from the sales of a firm are used to pay the fixed and variable costs of production, and any profit can be used either to increase production or to decrease the bank debt if there is any. In this way, the firm tries to finance its growth and to avoid going near its credit limit. If a firm exceeds its credit limit then it is declared bankrupt and is closed down.
A very important issue that arises in the modeling concerns the rationality of the manager of the firm in electing to adopt whatever strategy is chosen. In traditional economic theories firms are supposed to act, or to have acted, in such a way as to obtain maximum profit. But, here, we can see that if we used the profit as the driving force for increased production, then the system could not start. Every new action must start with an investment. That is with a negative profit. So, if firms do start production, and increase it, then this cannot be modeled by linking the increase in production to the profit at that time. Instead, we might say that it is driven by the expected profit over some future time. But this is clearly wrong, since their expected profits would depend on the behavior and expectations of other firms.
Whatever firms expect, in reality, clearly some of them get it wrong, because a large fraction go bankrupt. In our model therefore we simply have assumed that managers belief in the strategy that they have, and that if it doesn’t work, they either change it according to their adaptive rules, or they go bankrupt. Our model shows that it is the economies and dis-economies of production and distribution that will determine the number, size and scale of the niches that may be discovered.
Through?these?multiple?simulations?we?see?that?Darwinian?learning?is?very?ineffective,?and?the?best?overall?performance?is?achieved?by?firms?with?learning?mechanisms
We can use our model to explore the effect of different learning strategies of firms. The strategy space in view here is that of what % profit to charge and what quality of product to make. Obviously, a lower mark-up will provide larger market share, and lead to economies of scale, but these may not come soon enough to avoid bankruptcy. Alternatively, a firm can have a very high mark-up and make much profit on each unit it sells. However, its sales may be too small to allow survival. The first example of market evolution will be a kind of Darwinian method called ‘death and replacement’.
Darwinian learning: In this case we launch firms with random strategies, and if a firm goes bankrupt, we replace it with a new firm, with a random strategy. In this way, in theory the performance of the market will improve as unsuccessful strategies are eliminated, and only successful ones remain after a long time;
All imitate: Here, firms are launched initially with random strategies, but firms adopt the strategy that is winning. In this way, in theory, the resulting market should evolve to a collection of firms all using a very successful strategy;
All learn: In this case, after being launched with random strategies, firms each explore the effects on profits of changing quality and mark up. They then move up the profit slope—if possible. In this way, they demonstrate the effect of a learning strategy;
Mixed strategies: Here, after a random launch, we have two Darwinists, two imitators and two learners. This leads to an evolution of the market structure gradually exploring and changing as profit and loss select for the winners and losers.
The results of these simulations are shown in Figure 7.
The model allows us to test which strategies firms should adopt for the greatest chance of success. It shows us that it is false to believe that firms can simply come to market with Price/Quality strategies that they believe will work, and that their success or failure in the market will effectively lead to efficient economic market structures. The model shows us that average market value achieved by the process, including the cost of bankruptcies, is actually negative. In other words, Darwinism, applied to market evolution, using bankruptcy as the selection process is so costly on average that the industry as whole makes a loss. There is in fact enormous variance in the performance of the market as a whole, with some simulations showing very effective organization by chance, and others with very negative performance following a different sequence of choices.
53?Characteristics?of?manufacturing?organizations
The next block of simulations looks at the performance of the market when the players all imitate any winning strategy. This does perform better than Darwinian learning on average, with an average final value of over 800,000 compared to -114,000. But the strategy seems to provide the most unstable trajectories, with some examples of market crashes and severe set-backs in the general pattern of improvement.
In the third set of simulations, all the firms adopt an ‘experimental’ strategy of probing their ‘profit’ landscape and moving in the direction of increase.
The simulations could be used to examine particular cases, and could offer advice to particular firms engaged in market competition, however, here we are really more interested in investigating the general properties of evolutionary markets. Our model shows us that the basic process of ‘micro-variation’ and differential amplification of the emergent behaviors is the most successful process in generating a successful market structure, and is good both for the individual players and for the whole market, as well as its customers (Metcalfe, 1998, 1999).
Evolution of manufacturing organizations
The study of organizational change and strategy can be looked at by reflecting on the organizations in terms of their constituent practices and techniques. The changing patterns of practices and routines that are observed in the evolution of firms and organizations can be studied using the ideas of ‘evolutionary drive’. We would see a ‘cladistic diagram’ (a diagram showing evolutionary history) showing the history of successive new practices and innovative ideas in an economic sector. It would generate an evolutionary history of both artifacts and the organizational forms that underlie their production (McKelvey, 1982, 1994; McCarthy, 1995; McCarthy, et al., 1997). Let us consider manufacturing organizations in the automobile sector.
With the characteristics listed in Figure 8 as our ‘dictionary’ we can also identify sixteen distinct organizational forms:
Ancient craft system;
Standardized craft system;
Modern craft system;
Neocraft system;
Flexible manufacturing;
Toyota production;
Lean producers;
Agile producers;
Just in time;
Intensive mass producers;
European mass producers;
Modern mass producers;
Pseudo lean producers;
Fordist mass producers;
Large scale producers;
Skilled large scale producers.
Cladistic theory calculates backwards the most probable evolutionary sequence of events (refer to Figure 9). Again, in agreement with the ideas of ‘evolutionary drive’, we shall look at this as being the result of micro-explorations, and then a differential amplification of systems with emergent capabilities. We have studied the evolution of the automobile production industry by conducting a survey of manufacturers, and obtaining their estimates of the pair-wise interactions between each pair of practices. In this approach, the microscopic explorations consist in the attempts to connect in new practices to an existing system, with the object of improving performance and creating positive emergent capabilities. As has been reported before, we can understand and make retrospective sense of the evolution of the automobile industry.
We have then been able to develop an evolutionary simulation model, in which a manufacturing firm attempts to incorporate successive new practices at some characteristic rate. The ‘receptivity’ of the existing complex determines which new practice will in fact be amplified or suppressed if it tries to ‘invade’.
Figure 10 shows us one possible history of a firm over the entire period of the development of automobile production. The particular choices of practices introduced and their timing allows us to assess how their performance evolved over time, and also assess whether they would have been eliminated by other firms. As a result of the different firms experimenting over time, there is an incredible range of possible structures that can emerge, depending simply on the order in which practices are tried. But, each time a new practice is adopted within an organization it changes the ‘invadability’ or ‘receptivity’ of the organization for any new innovations in the future. This is illustrates the ‘path dependent evolution’ that characterizes organizational change. Successful evolution is about the ‘discovery’ or ‘creation’ of highly synergetic structures of interacting practices.
The model starts off from a craft structure. New practices are launched with an ‘experimental’ value of 5. Sometimes the behavior declines and disappears, and sometimes it grows and becomes part of the ‘formal’ structure that then conditions change which innovative behavior can invade next. Figure 11 shows us the number and linkages between the practices characterizing the 16 different organizational forms. Overall performance is a function of the synergy of the practices that are tried successfully. The particular emergent attributes and capabilities of the organization are a function of the particular combination of practices that constitute it. Different simulations lead to different structures, and there are a very large number of possible ‘histories’. This demonstrates a key idea in complex systems thinking. The explorations/innovations that are tried out at a given time cannot be logically or rationally deduced because their overall effect(s) cannot be known ahead of time. Therefore, the impossibility of prediction gives the system ‘choice’.
The?cladistic?diagram?for?automobile?manufacturing?organizational?forms
Successive?moments?(t=3000,?10000?and?15000)?in?the?evolution?of?a?particular?firm
The evolutionary tree of the organization emerges over time.
The competition between different firms’ exploratory pathways through time means that those who, for one reason or another, fail to find synergetic combinations of practice, will be eliminated. Once again we find the principle of ‘evolutionary drive’, where the micro-explorations involving the testing of new practices leads to microscopic diversity among firms, and in turn these are either amplified or suppressed by the economic competition.
Research communities
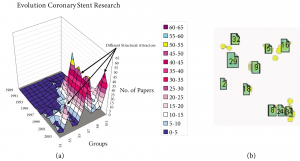
Another example of these ideas is that the structural attractors, such as the market configurations and organizational forms of the sections above, can be seen in considering the research literature that expresses how communities of researchers create, and evolve successive different structural attractors. In a study of medical research papers concerning the treatment of a particular form of heart disease, the literature of successive years in a particular domain have been analyzed, and the keywords and contents have been analyzed into different groups of research approach (Ramlogan, et al., 2006). From this we can see how ideas lead to ‘clusters’ of researchers and papers with particular set of dimensions or keywords, and how these evolve onwards to new structures over time. In this example we see how an initial idea develops, and other different attractors emerge over time. In science we would generally see the activity of some attractors waning, and others emerging and temporally taking over. This illustrates the concepts of structural attractors as resulting from the connection of different concepts from a possible dictionary of concepts that is also itself being extended by microscopic exploratory thoughts. Sometimes a new idea will be tried out, with a single ‘outlying’ paper starting off. However, this may either be picked up and become a new cluster, or may die out as an unsuccessful exploration.
Figure 12 shows us that evolution is about the discovery and emergence of structural attractors (Allen, 2001a,b) that express the natural synergies and conflicts (the nonlinearities) of underlying components. Their properties and consequences are difficult to anticipate and therefore require real explorations and experiments, to be going on, based in turn in diversity of beliefs, views and experiences of freely acting individuals.
Successive?connected?structures?(structural?attractors)?of?the?53?possible?practices?through?the?key?bifurcation?separating?the?Mass?Production?and?Japanese?type?organizations
a)?The?emergence?of?different?research?clusters?over?time?as?multi-dimensional?structural?attractors;?b)?A?2-D?view?of?the?‘proximity’?of?clusters?in?2003
Conclusions
From the discussions and models presented above we can derive some key points about evolution in biological and human systems.
Evolution is driven by the noise to which it leads;
Evolutionary Drive results from the existence of noise and micro-diversity generating mechanisms at the lower levels of the system, which over a longer time scale enjoys differential dynamic growth or decline;
This mechanism, therefore, also selects for systems that retain noise and micro-diversity generating mechanisms within them;
This means that aggregate descriptions will always be short term descriptions of reality, useful perhaps for operational improvements, but not providing any real indication of the potential for instability and structural change;
Successful management must behave as evolution does, and make sure that mechanisms of exploration and experiment are present in the organization. Though they are not profitable in the short term they are the only guarantee of survival into the longer term;
In considering the evolution of knowledge in whatever domain over time, we see that knowledge involves articulated words, concepts and variables that inhabit certain dimensions and which together are deemed to provide some emergent capability. Over time the cluster evolves as new connections are made involving new variables and dimensions. These either run in parallel, catering to different parts of the ‘market’ or actually replace them as being the ‘improved theoretical view’;
Structural attractors correspond to these emergent clusters: for products it is bundled technologies; for markets it is certain bundles of coevolving firms; for organizations it is bundles of coevolving practices and techniques; for knowledge more generally it is bundles of connected words, concepts and variables that emerge for a time;
In traditional natural science a new theory must be capable of being falsified, and therefore must produce testable predictions, which if successfully verified lead to cumulative knowledge. In complex systems however, clean predictions are no longer possible and the knowledge evolves under less severe selection criteria. In human systems, emergent structural attractors can occur simply because there is demand for their particular emergent capabilities. Fashion, lifestyles, art, artefacts and communities of practice can emerge and survive providing that there is a clientele for them. They are not about being ‘true’ or ‘false’ but simply about whether there is a ‘market’ for them;
Living systems create a world of connected, coevolved, multi-level structures which may be temporally self-consistent, but will evolve and change over time. New ideas (technologies, strategies, practices, and concepts) feed into this world of self-organized structures, and can either be amplified or suppressed. They may either replace a previous attractor, or find their own niche after some adaptation and change, or they may be eliminated.
These results fulfil the transformation of our view of the world from ‘Being’ to ‘Becoming’ as was put forward originally by Prigogine, and colleagues (Nicolis & Prigogine, 1977; Prigogine, 1981; Prigogine & Stengers, 1987).