Introduction
This article approaches the spatial development of the port of Rotterdam in the Netherlands from a coevolutionary point of view. We use two main concepts within coevolutionary framework; bounded instability and punctuated equilibrium, to understand the relationship between Dutch spatial policies and actual developments in the port of Rotterdam.
Spatial planning involves the deliberate arrangement of activities to give shape to a space (Healey, 2006; Cars et al., 2002; Hajer & Wagenaar, 2003). The Netherlands is one of the most densely populated countries in the world (470 persons a square kilometer in 2001). Land is a scarce commodity, especially in the western, most urbanized parts of the country.
Transport (roads, waterways, railways) places significant strain on spatial considerations. With the Netherlands being home to both one of Europe’s main airports and Europe’s largest seaport, transport is a high priority in any spatial planning effort.
This article focuses specifically on the seaport of Rotterdam, which is one of the main cargo junctions in the world. Its central location in Europe along with the open access it offers to the North Sea makes the port ideal for shipping goods between Europe and the rest of the world.
The port has been growing rapidly since the 1960s. With the port’s growth came an urgent need to manage the expansion and the emphasis on planning has moved over the years from being a concern purely of some public actors (ministries and port authority), to one of priority across several public bodies and non-public actors (Healey, 2006; Kickert et al., 1997).
We investigate the planning capacity of Dutch governments in this article, aiming specifically to give meaning to the relationship between public planning and the physical development of the Rotterdam seaport. We use an analytical framework based on the idea of coevolution. This framework is introduced and detailed in the section titled “The coevolutionary framework”. The section titled “Association between variables” deals with methodological issues, and the construction of the variables. The next section, “Port System of Rotterdam”, provides a brief introduction to the port as well as to the policy system. An understanding of the nature of the relationship between port related policies and actual port developments requires a longitudinal investigation and our investigation goes back 45 years, covering the period from 1960 to 2005. We analyze the relation between port and policy in detail in section “Analyzing the relationship between the port and policy systems”, and present the conclusions in the final section.
The coevolutionary framework
Generally speaking, evolution is the process of change that occurs amongst members of a species, populations and systems. Evolutionary changes can sometimes be small, at other times large, either fast or slow. While the word ‘evolve’ has been used to denote change in any number of contexts, Mulder and Van den Bergh (1999) point out that a distinction should be made between biological evolution and evolution in the social world. A main characteristic of biological evolution is that progress through time happens without any intention on the part of the elements of the system. In other words: neither the system as a whole nor the elements it comprises is able to ‘steer’ the direction and speed of evolution.
Societal actors, however, are able to steer the manner in which their systems evolve. Of importance in this view is the fact that actors indeed have an influence on the course of things, but the magnitude of their influence depends of the resilience and capriciousness of the environment. In societies, actors are not isolated from other actors or developments in the system such as economic changes and technological innovation. The notion ‘evolution’ should therefore be replaced by the notion of coevolution, meaning that actors and systems evolve through each other; their interaction is the primary reason for evolution (Van den Bergh & Gowdy, 2000). This term has its roots in biology, evolutionary economics and environmental science, but has appeared in other fields of science as well (Kauffmann, 1993; Norgaard, 1994; Mulder & Van den Bergh, 1999). The concept is rooted in the notion that complexity arises from the inter-relationship, interaction, and interconnectivity of elements within a system, and between a system and its environment. In such a situation, the actors attempt to adapt themselves to new situations in order to position themselves for a better fit that allows them to reach their goals—but each of these adaptive moves also elicits adaptive moves by other actors. A complex pattern of interaction is born that repeats itself through time, though not always in consistent ways.
Actors not only coevolve with each other, but also with their environment. This environment is in principle, unlimited. It may encompass physical developments such as changes in the sea level or economic changes such as the impact of China’s economy on shipping. Thus, coevolution is not only a result of the interaction between actors, but of the interaction between actors and their environment (cf. Norgaard, 1994).
Having said that, the question arises of what exactly constitutes the processes of coevolution. From a purely linear perspective, changes should occur without shock and capricious movement. Social reality is somewhat different and the coevolution between elements is characterized both by whimsicality and non-linearity. Two mechanisms of development through time are essential to understand non-linear development: bounded instability and punctuated equilibrium.
Bounded instability is the idea that systems balance between order and chaos (Merry, 1999; Griffin et al., 1999; Stacey, 2003; McElroy, 2003). Order here implies fully structured and mechanically functioning constitutions, while chaos indicates the absence of any such order resulting in seemingly randomness. Systems do not develop fully through order alone because order implies a simple repetition of the same events. They do not develop entirely through chaos either, such that everything happens randomly and nothing occurs out of structural decisions and efforts. Under the framework of bounded instability, development happens through the dynamic interplay between order and chaos. Order ensures a degree of predictability and stability whereas chaos encourages innovation and progress. The line between order and chaos should be maintained without toppling into one of the two distinct dimensions. Actors in a coevolving system try not just to adapt to the environment in order to survive, but to influence the environment in a preferred direction wherever possible. Thus, whilst actors and elements within the environment may try to change themselves to adapt to the environment, they try also to maintain or re-enforce their current status and influence the environment to evolve in a different direction. Systems balancing in such a situation are said to be in a state of bounded instability.
Under the punctuated equilibrium framework, systems are seen to go through periods in which everything is seemingly at ease and other periods of severe fluctuation. Processes within the system are thus subject to periods of acceleration and the occasional shock (Baumgartner & Jones, 1993; Mulder & Van den Bergh, 1999). These changes from seemingly stable states into states of instability are fundamental to the concept of punctuated equilibrium. The reversal into periods of fast change is not necessarily caused by one particular event, although events can function as the final trigger, but is seen to be the result of a build-up of system pressure. Such pressure can increase whilst the system appears to be in a rather stable state until a certain threshold is reached. After that, swift changes take place that cause the transition from one state to the other. A phenomenon or condition occurring far away in time and space may have a delayed reaction on the subsystem, thus making it difficult to pinpoint the cause of every effect.
The empirical focus here is on the coevolution between a policy system and a port system. The policy system is defined as the ideas, future plans, and forecasts held by policy makers and port authorities at the national and regional level and approved in formal policy documents between 1960 and 2005. The port system is defined as the spatial development of the port that took place in it between 1960 and 2005.
Four variables are identified to structure the data for both policy and port systems and operationalize it at a level that can be measured. Analogue to Welters and De Langen (2001), these variables are goods, functions, actors and connections.
Diversity of goods (low—high): Port: all types of cargo being transported to and from ships. Policy: types of cargo that the port should handle.
Diversity of functions (low—high): Port: actual transport, logistics, production, and trade. Policy: the proposed diversity of functions.
Diversity actors (low—high): Port: actual shareholders and stakeholders of the Port of Rotterdam. Policy: formally recognized shareholders and stakeholders by the policy-makers.
Diversity of connections (low—high): Port: both actual physical (roads, railroads, pipelines) and social connections (formal and informal cooperation between actors). Policy: proposed types of physical and social connections.
The value of each variable may change over time, depending on whether the level of diversity changes. Diversity refers specifically to the heterogeneity of the components subsumed within the categorical variables. The variable goods, for example, is represented in practice by dry bulk, liquid bulk, fruit containers, project cargo and other such types. When the variety of the goods is great, we speak of high diversity, regardless of the volume.
The variables are scored for diversity on a scale of 1 (very low diversity) to 5 (very high diversity). The diversity score of each variable changes over time and the scores are plotted for both systems over the observed time frame (1960-2005).
Association between variables
Empirically, the number of variables involved is infinite and ever changing and attempting to find fixed cause-effect relationships is vain and does not do justice to the complexity of the whole (Haynes, 2003; Byrne, 2005). Narrowing the coevolving complexity of the two systems down to four variables as in the present analysis may harm the real complexity, even if the variables encompass the most important dimensions of the activity and development of the port. Still, given practical limitations, it is the best available way to investigate the developments of multiple dimensions over a long period. Byrne (ibid.) affirmed this view, saying that it is inevitable for researchers to focus on key-variables as long as it is understood that these do not present the full complexity of actual developments, but rather, provides tangible traces of it. We focus on the association of variables through time and an attempt is made to understand the coevolving nature of the relationship through the use of the coevolutionary framework.
The evolution of one variable (goods, functions, actors or connections) through time can be characterized by the idea of bounded instability. This occurs when the development is ongoing and marked by increasing progress without much turbulence. Punctuated equilibrium however, characterizes the evolution of multiple variables in association, hence leading to coevolution. It is marked by a divergence and convergence of the two systems through time. Divergence may bring about a build-up of system pressure; while convergence may be a sign of release. Together, they cause the systems to evolve towards each other again.
Data for this research was obtained from policy documents related to the port of Rotterdam released between 1960 and 2005. Relevant documents (see Appendix 1) were collected from different Ministries, the Regional Authority of South-Holland and the (Municipal) Port Authority Rotterdam. Another main source of information was the work by Van Duinen (2004), which describes the historical development of planning concepts in Dutch national spatial policy. Van Klink (1995) wrote about the functional, spatial and administrative dynamics of the Rotterdam port system as did De Langen and Welters (2001).
Port System of Rotterdam (1960-2005)
Founded in the 13th century at the border of the River Rotte, the port of Rotterdam has had a particularly long and vibrant history. It was the dam in the River Rotte from which came the name Rotterdam. From beginnings 700 years ago, the port slowly evolved into one of the main seaports of the world.
Immediately after World War II, the port quickly became sign of the city’s re-growth and became the major European port for the transshipment of all kinds of materials with which the city, the country and even parts of North West Europe were eventually repaired. The strong competitive position of the port was exploited in the 1960s when the transshipment of bulk goods and general cargo grew exponentially. The port began extending westward and new docks were built to facilitate the growth. In 1962, Rotterdam became largest port in the world. It also became the main port for oil in Europe, triggering the development of extended oil industries. 1966 saw the beginning of the containerization of general cargo and Rotterdam established docks suitable for their processing. Several general cargo firms cooperated to establish the first container-handling terminal in Rotterdam.
The ‘Maasvlakte’ project was initiated that involved the reclamation of about 1000 ha of land from the North Sea. The oil crisis of 1973, however, led to diminished optimism and societal resistance rose against the ongoing development of the port. The value of port extensions was no longer self-evident. However, the oil crisis did not have negative effects on transshipment volumes.
In 1980s port development stagnated because the growth rates flattened. The extension of the port was slowed down by a worsening investment climate and the general cargo sector was heavily restructured. Many firms were saved by their efforts to reorganize, but the shipbuilding industry disappeared. Only infrastructural investments were not threatened.
The 1990s saw a recovery of both transhipment and investment activity. The recovery was grounded on the boost in the container sector. Almost every sector started to grow anew In addition, environmental and safety concerns were fully incorporated themes in the port investment plans of this period.
To summarize, the port has been growing steadily since the 1960s, albeit at varying rates. The functions of the port have increased dramatically with this growth, and among other value-adding activities, an entire petrochemical cluster was developed. Along with the growth also arose a greater focus on the environmental impact of the port’s development and lots of physical and social connections were developed.
Mainport policy
Starting in the 1960s, policy makers developed a keen awareness of the potentials of mainport development. This focus arose largely out of an understanding of the favorable geographical location of the Netherlands (Van Duinen, 2004). The First National Planning Report (1960) stated clearly that the ability to transfer goods should serve as the base for national economic development. A Policy Paper on Seaports accompanied this national report. The public discourse in this regard was dominated by the transshipment potential of the port. At the end of the 1960s, the municipal port authority proposed a highly ambitious Port Plan 2000+, which called for massive extensions incorporating areas that even now are not yet within the port’s terrain. The ambitions of the proposal’s writers were simply deemed too great and the national and provincial governments immediately rejected the proposal.
Towards the end of the 1960s and throughout the 1970s, the landside accessibility of the port came under pressure and started seeing greater prominence on the policy agenda. The importance of landside and seaside accessibility was stressed in the First Structure Scheme on Seaports as this was seen as necessary for the further growth of the port.
By the 1980s, Rotterdam and its port were increasingly regarded as essential to reviving the struggling Dutch economy. The mainport was dubbed the Gateway to Europe in the international logistic chain. This vision was further developed in the years that followed (Ministry of Spatial Planning, Housing and Environment, 2005). The notion of a “mainport” was officially introduced for the first time in the Fourth Report on Spatial Planning (1988). The spatial policy in place at that time was based on the logistic strengths of The Netherlands. Within this context, highest priority was given to improving the quality of the infrastructural and logistical node, and in particular to the task of removing the bottlenecks in the infrastructure around the ports (Van Duinen, 2004; Second Structure Scheme Transport, 1989; Priemus & Visser, 1995). The province of South Holland was decreed to build the infrastructure to accommodate the growing levels of traffic to and from the port.
In 1992, the municipality proposed another new plan (Port Plan 2010). It focused on growth, with the following key proposals:
New large-scale container terminals;
New infrastructure within the port, as well as to and from it;
Distriparks to add value to container freight;
Strengthened industrial port segments.
The strong mainport driven focus diminished in the mid 1990s, due in part to increasing public attention on the negative effects the mainports had on the environment in terms of noise and pollution. Other economic sectors such as e-commerce were growing rapidly, and the importance of the mainports for the economy was somewhat reduced. Less attention was paid to the mainport in the Fifth Spatial Planning Report (2001). This decline in attention was set against a period of intense debate, and strong clashes between economical groups and more environmentally oriented actors.
More recent policy documents include Choosing Growth (2004), Peaks in the Delta (2004), Mobility Strategy (2004) and the latest sixth National Planning Report (2004) show a shift in priorities. The focus on mainports has been reintroduced. The stress has gone beyond the national level and more attention is being paid at the provincial level under a structural plan that devotes much attention to the growth of the mainport in a sustainable way. The perception of the port as primarily an infrastructural object, providing accessibility and connectivity has not changed (Huys & van Gils, 2004).
The Port Plan 2020 was released in 2005 as a manifesto of the privatized port authority to advocate the sustainable development of the mainport. While development has traditionally been dominated by talk of terminals and accessibility measures, the focus has now broadened somewhat to include IT plans to optimize accessibility and better care of the living environment. The plans are showing up an awareness of the connections with many actors.
Analyzing the relationship between the port and policy systems
The diversity scores registered by each of the variables over the observed time frame (1960-2005) are plotted for both systems. The next sub-section discusses the general coevolution of the port and policy systems. The development of each variable is then detailed in subsequent four sub-sections and comparisons are made in relation to overall levels.
General coevolution
Figure 2 shows the combined score of the four variables distinguished in our study. A scatter plot is created for both systems in Figure 2 by averaging the scores observed between 1960 and 2005.
From the plot, it appears that both systems develop in the same direction such that they display greater diversity over time, albeit at different paces. The port system appears to be generally more varied than the policy system, and it is only around 1968 that the policy system shows more diversity than the port system. This peak in diversity can be explained by the great ambition displayed in the Port Plan 2000+ (1968). As described in earlier this plan was somewhat revolutionary for its time.
1968 figures not-withstanding, both systems showed similar levels of development, at least until 1983 when the port system began to develop with more diversity. The two systems appear to develop closely again from 1988 to 1993, after which the policy system showed substantially less diversity then the port system. This trend continued until the year 2005 when the study was completed.
The difference in scores is the largest in 2002, and a gap of almost two points is registered on our scale. This was the period of growing social strife, when the Fifth Planning
Report was published but never formalized because of crisis in the cabinet. The seaport of Rotterdam received less policy attention and became less central to the spatial policies of the time.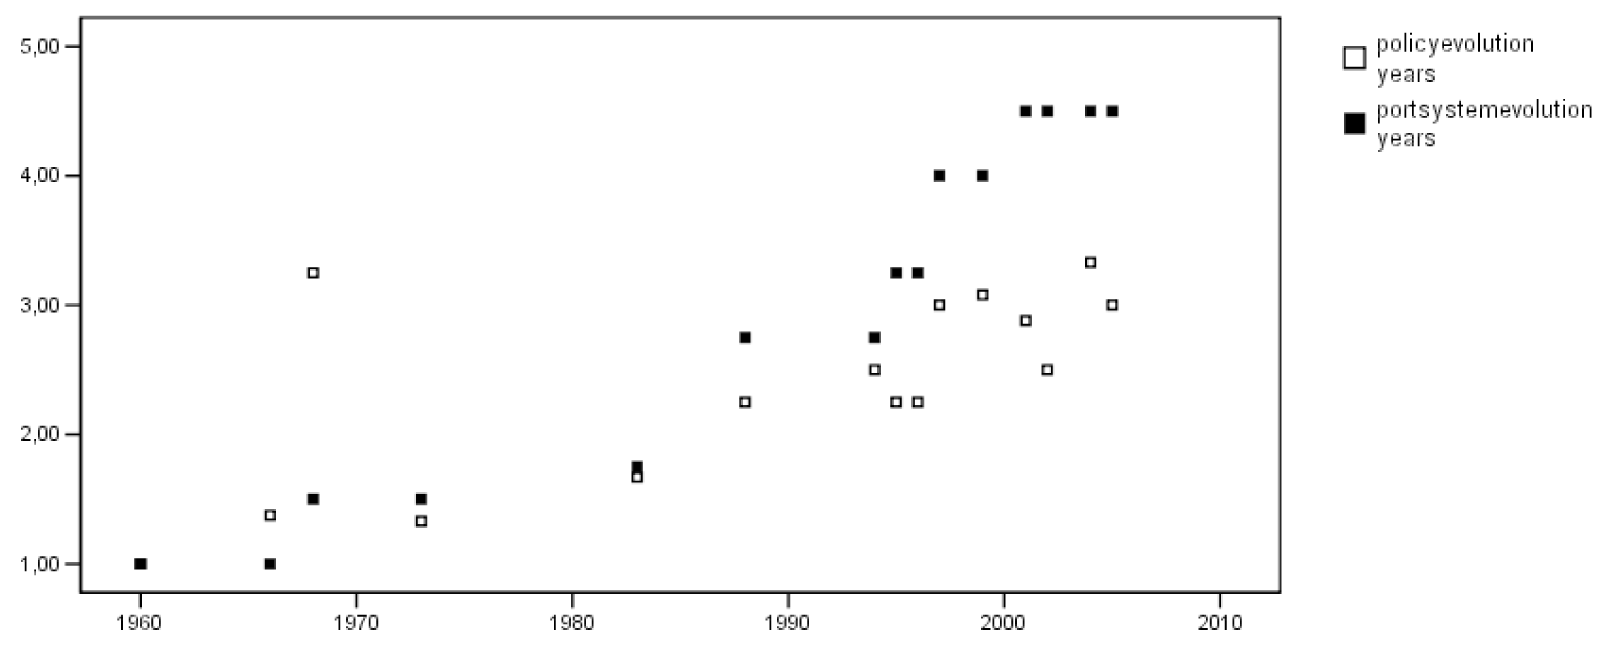
Although both systems coevolve in the same direction over time, we do see some clear differences. The port system appears to develop gradually, slowly increasing its diversity in terms of the type of goods and number of connections, while the policy system is characterized by a more erratic course of development. From 1995 onward, the policy system appears to develop in fits and starts. It grows in diversity from 1995-1999, but then falls back again from 1999-2002. Between 2002 and 2004, the policy system again appeared to be growing in diversity, only to fall back again after 2004. The year saw an increasing port-focus at the national level that was not accompanied by a similar increase at the regional policy level.
In the next section we will compare the development of the port and policy systems, across the four variables, focusing in particular on irregular patterns in the graphs.
Development of goods
Figure 3 shows that the trajectory of the goods plot does not differ much from the average scores of all the variables combined (Figure 2). We see one moment in time (1968) when the diversity of goods in port policy was higher than that of the port system. This divergence can be ascribed to the Port Plan 2000+ (1968) that pointed the way towards tapping the big growth markets in goods.
One other striking difference can be found however. Around the year 2000, the diversity of goods in the policy system appears to be substantially lower than that of the average figure. The focus of business at the time remained on general cargo, oil, ores and grains. Limited attention was given in policy documents to developing the growth of ‘newer’ goods like liquefied natural gas.
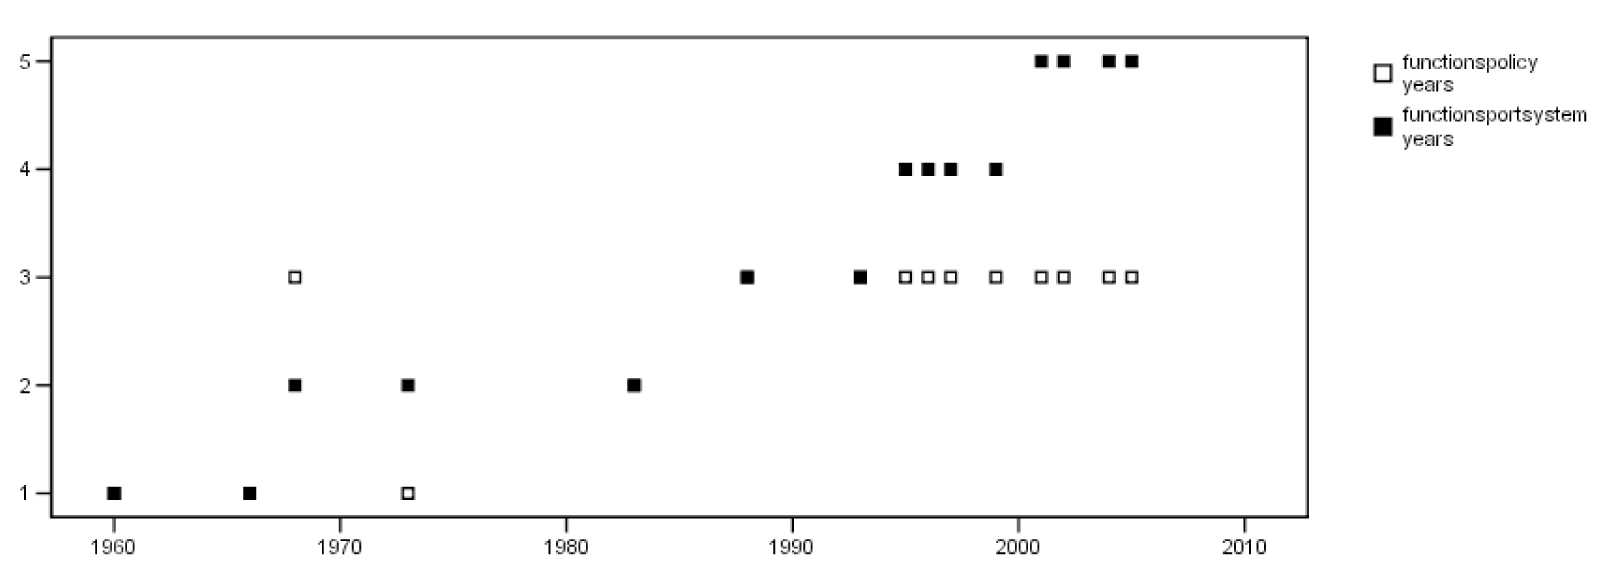
Development of functions
Figure 4 shows that the plot for the variable ‘functions’ does not differ very much from those from the average of all variables (Figure 2). Two differences can be traced, the first being the high diversity of the policy system in 1968. The second difference appears at the flat end of the policy system graph for the period between 1995 and 2005. The flatness points toward a rather stable level of attention on functions in that period. From the data, it appears that the policy focus remained on transhipment, distribution, and the processing of chemicals. New functions were hardly mentioned in policy papers of this period, although viable ones included roll-on-roll-off, and the use of energy resting in the chemical sector for the heating of houses in the Rotterdam area.
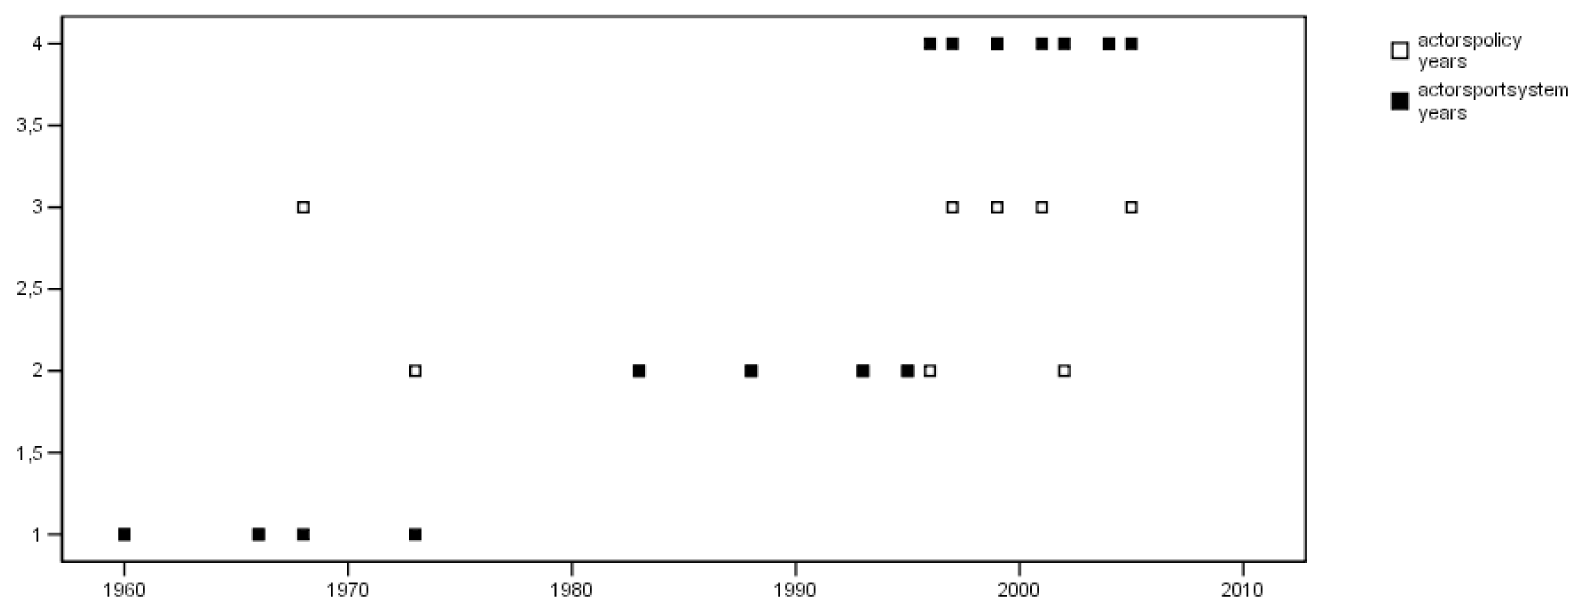
Development of actors
The diversity of the ‘actors’ in both systems is not very high (see Figure 5). The influence of Port Plan 2000+ shows up clearly on the graph in 1968, because according to its recommendations, many more workers were to be involved in future port development. The constructed policy system graph was not getting more diverse in the time from 1960-2005, while the average was growing gradually, albeit slightly erratically. The diversity of actors involved from the policy perspective remained at a stable level and while more actors came into the port system, not much was added in terms of their diversity. Both environmental pressure groups and economic interest groups were present from the 1960s onwards, with the former becoming more influential over time.
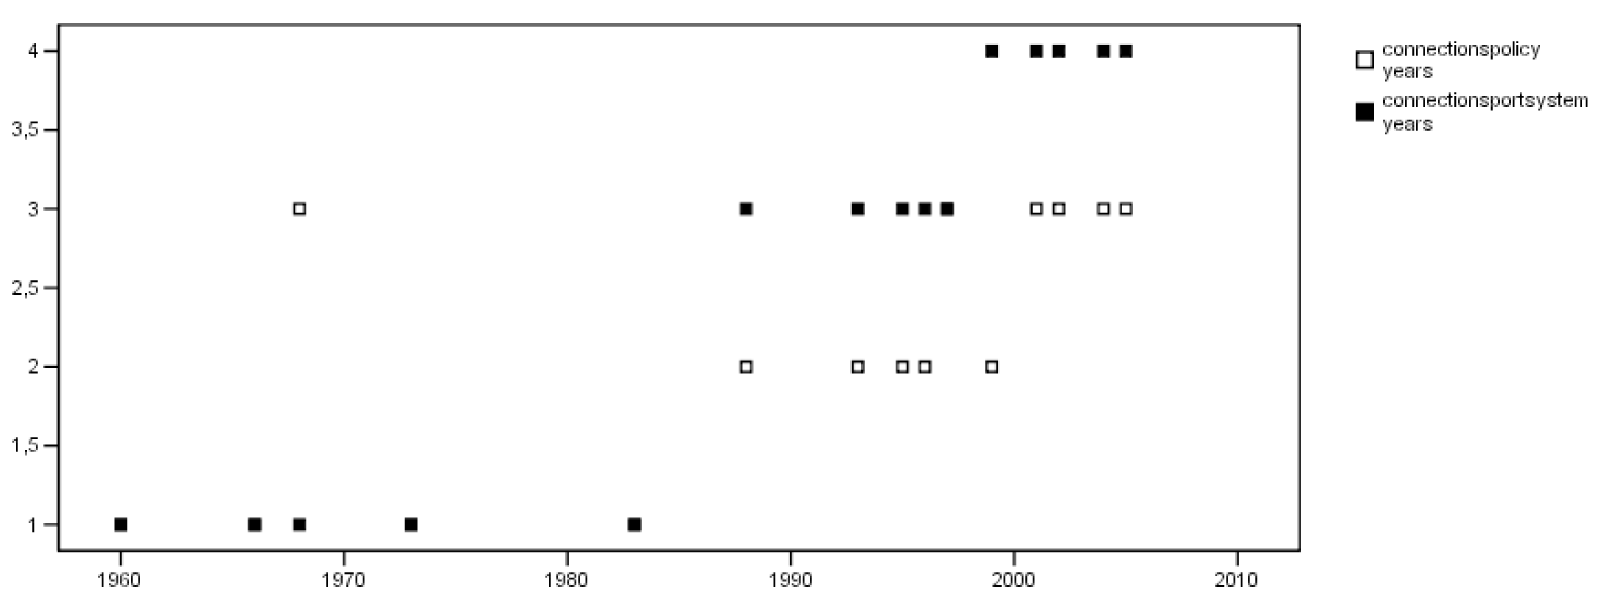
Development in connections
The variable ‘connections’ (see Figure 6) shows a similar pattern to that of the other variables and the plots in Figure 2. Connections were not particularly diverse in either the port or policy system over the period of analysis. Not unexpectedly, Port Plan 2000+ (1968) caused a spike in the diversity of the variable as it proposed many new waterways, pipelines and other forms of physical links.
As previously established, the port system as a whole shows a gradual increase in diversity with regards to all the variables while the policy system shows a more erratic course. The variable ‘connections’, however, does not mimic the erratic course of the policy system’s
average graph. Every policy document paid some attention to the issue of physical linkages, but none of these was quite as revolutionary as Port Plan 2000+. Even when the mainports got less attention, there was no decline in the level of attention paid to the construction and maintenance of the waterways and the Eurogeul—a waterway to connect new port terrains with the North Sea—is a case in point. Turning to social connections, when the negative effects of port development (noise, pollution etc) received heightened attention early this decade, the new policies presented strategies for cooperation (i.e., social connection) between the main actors and environmental groups.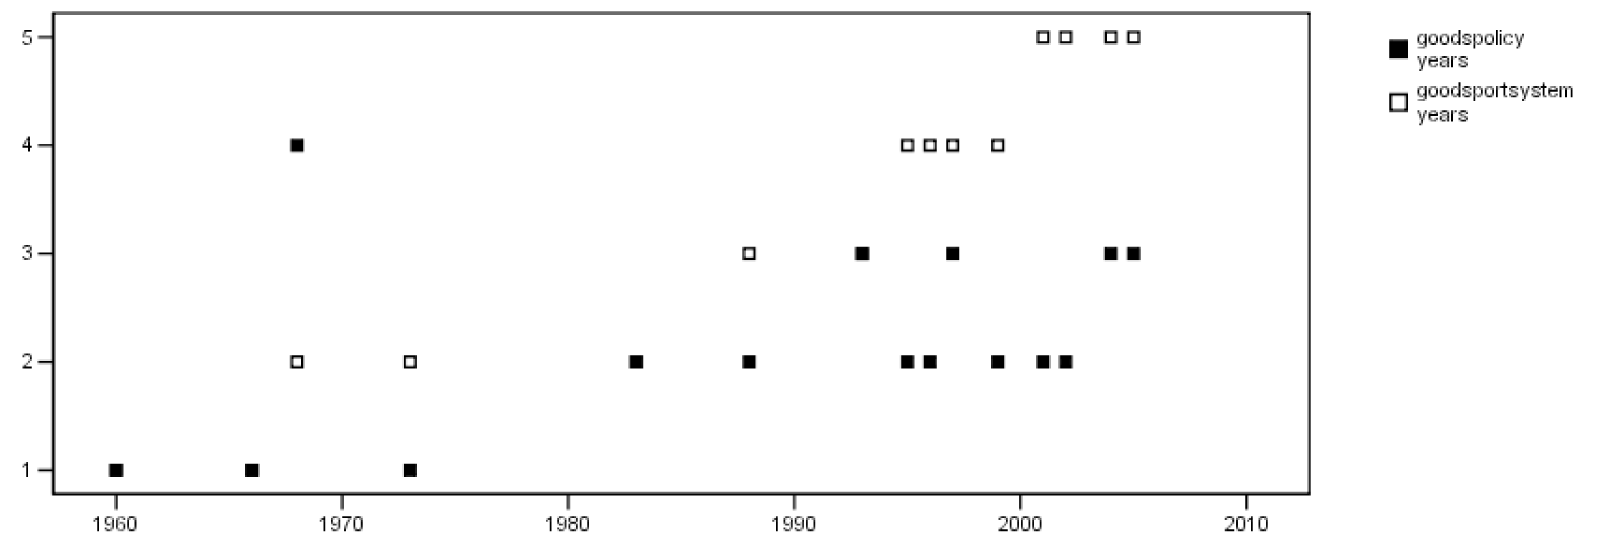
Research findings
We can tell from Figure 2 that the port system has a higher overall level of growth in diversity than the policy system. Related to this observation, we see that while the systems coevolve in terms of time and direction, each system has its own nature of development (Figure 2). The aggregate figure displaying the mean scores of all variables of the policy and port systems shows two points of diversion. The first divergence occurs when port Plan 2000+ was implemented, presumably because of the high level of ambition displayed by some policy makers. This ambition was not shared triggering a relative decline in the policy ambitions in the years that followed. A second divergence occurred in the mid 1990s when the diversity on all variables in the port system steadily increased in the absence of any such indications in the policy system.
Apart from these two main periods of divergence, both systems developed in largely similar ways from 1973-1987. Although periods of increasing diversity tend to alternate with periods of decrease, a gradual increase can be observed in the overall diversity of both systems.
Taking a look at each variable separately, coevolution can also be discerned with rare instances of major deviation. The only notable pattern is in the ‘connections’ variable in the period following the year 2000 when the policy system lagged behind the port system. It is reasonable, however, to assume that all the separate variables except ‘connections’ generally represent the developments of the overall system.
At first glance, it may seem that the policy system either responds very slowly to developments in the port system, or fails to respond at all. But such an observation does not do justice to the complexity of the relationship between the systems. It is through bounded instability and punctuated equilibrium that the changes in the coevolution gain meaning.
Bounded instability can be seen several times in the scatter plots when periods of stability (depicted by a flattening of the scatter plot) alternate with periods of fluctuation. It appears particularly prominently in the policy system in the period from 1995 to 2005, and to a lesser but more dramatic extent when Port Plan 2000+ was introduced in 1968. The port system itself changes as well, but more incrementally. It does not display characteristics of bounded instability.
The first period of instability is marked by the release of Port Plan 2000+ in 1968. This plan put forth proposals for considerable change, and was largely rejected by the authorities concerned. The rejection, the oil crisis of 1973 and the ensuing public resistance translated into diminished policy objectives. It followed then that this first period of bounded instability did not lead to significant change, and things returned to their older, more stable levels.
The second period of bounded instability occurred within the policy system in the period from 1995 to 2005. There are two major reasons for these fluctuations. Firstly, the growing role of the service economy and information technology driven businesses on the Dutch economy meant a marked change in focus and port economics was seen as something of a relic. Others, however, continued stressing the importance of the port throughout and their wisdom was apparent when it later became apparent that neither the service economy nor e-commerce was able to deliver the expected results. The focus eventually shifted back to the port, and this series of changes can be clearly discerned in the scatter plots.
Secondly, this period of bounded instability coincides with the admittance of more actors to the port policy network. While the interest in port affairs has been increasing substantially since the 1970s, few new players were admitted to the policy network. From 1995 onward other policy actors started to develop their own ideas on the management of the port in Rotterdam. It is also interesting to note that the developments that were anticipated in the ambitious Port Plan 2000+ (1968) have partly come true. The plan that was deemed wishful thinking was indeed ahead of its time.
Turning to punctuated equilibrium as a function of the relation between the two systems, the data provides several indications as to why the developments occurred in the way they did. The high level of ambition displayed in the plan put inordinate amounts of pressure on policy makers and the system as a whole. The inability for the system to cope meant a reversal and a climate of more modest ambition.
No major changes occurred in the years that follow as a result of system pressure. It was only after 1993 that we again observe a period of divergence between the two systems. The policy system appeared to drift away from the developments in the port system, despite catching up briefly between the years 1998 and 2002.
Despite views that the port was diminishing in importance within the context of a service economy, the port system continued to develop and actors in the policy system needed to stay in touch with the actual developments. In other words, rising pressure from the port system shifted the attention of policy makers back towards the further development of the port.
The most striking observation, however, has to be that the policy system seems to follow the actual developments, rather than preceding them as would be commonly assumed. More surprisingly, it appears that from 1993 onwards, the policy systems has difficulty following the port system altogether. The only exception to this in the period following the announcement of Port Plan 2000+ in 1968 when the policy system displays more diversity than the port system. It seems clear then that policy visions are not a key driver in the more revolutionary developments of the port.
Concluding discussion
In the introduction of this article, we argued that in the Netherlands government often interprets and uses planning as a one-way process in which spatial developments are guided by spatial policies. Our conclusions show this assumption to be false. Spatial planning is not a sequential process that leads to changes in the physical port. Our research shows that the relation between policy and port is not a one-way street, and that port developments are more dominant than policies. Dutch mainport policy planning cannot be understood as a mode of forecasting and anticipating, but should instead be seen as an effort to codify and maybe support the actual developments of the port.
This does not mean however, that policies are without their use, but their function has changed. The provision of a strategic long-term, interrelating viewpoint is (still) the main task of governmental actors. However, instead of determining the future of the port, their main function is now to choreograph the interrelation between the variety of elements. It is true that Dutch port policies pay (more) attention to the actual developments in the port of Rotterdam, but this practical awareness does not translate into a coherent policy program that is in close touch with practice. Instead the policies produce panoramic visions and long-term plans as to the future of the port, that are very loosely coupled with actual port developments. Policy-making has its own internal rationality and dynamic that is often separate from the dynamics in the port. It would be inaccurate of us to conclude that Dutch policy-making does not take actually development of the port into account in their policy projections. Nonetheless, we clearly see that policy-making is slow in keeping with current port developments.
Critics to this analysis can argue that the port of Rotterdam has flourished for years, despite the codifying and supporting role of policy makers. We argue, however, that to be more effective, a policy system should reflect some more external diversity (cf. Ashby, 1964). Thus, a more effective way to handle diversity is perhaps to create diversity in the policy system itself that reflects the diversity in the actual port system while adding something specific to it. In this way a fruitful coevolution is created that strives for innovation in the port of Rotterdam. This coevolutionary way of governance (partly following, partly steering) seems more promising than thinking in terms of controlling the future.