Introduction
In an article to appear shortly (McCarthy et al., 2006) the NPD process has been shown to be a complex adaptive system. In earlier articles (Allen & Ebeling, 1983; Allen, 2001; Allen & Strathern, 2005) the theory behind the emergent nature of the innovation and the new product development process has been presented and discussed, linking it to the inherent uncertainties involved in system instabilities when new dimensions and descriptors are turned on. This is the fuzzy front end of the innovation process and corresponds in practice to “the period between when an opportunity is first considered and when an idea is judged ready for development” (Kim & Wilemon, 2002). In the fuzzy front end, ambiguity about the performance of the idea prevails, preventing it from being transferred to development where it becomes increasingly expensive to rework or kill non-performing product ideas as one proceeds through the process (Verganti, 1997; Thomke & Fujimoto, 2000).
The impact of fuzzy front-end early problem-solving on subsequent development and/or commercialization performance is widely acknowledged (Clark & Wheelwright, 1993; Bacon et al., 1994; Khurana & Rosenthal, 1997; Kim & Wilemon, 2002). Thus, problem anticipation or “front-loaded” experimentation is known as “a strategy that seeks to improve development performance by shifting the identification and solving of [design] problems to earlier phases of a product development process” (Thomke & Fujimoto, 2000). Existing management research on front-loaded experimentation conducted during front-end innovation has focused predominantly on the resulting cost efficiency and lead-time performance of subsequent product development in a variety of industries (Verganti, 1997; Verganti, 1999; Thomke & Fujimoto, 2000; Thomke, 2001, 2003).
However, in a pharmaceutical R&D context, a technology-intensive sector where typically lots of poor drug candidates get killed too late in the innovation process, it is of great interest to try to improve the detection of failure as early as possible. In an industry where a newly discovered therapeutic agent with blockbuster potential still faces more than a 90% chance of failure during the development phase (Kennedy, 1997; Duyck, 2003), and knowing that the fully loaded cost for the development of the agent now amounts to about one billion dollars (Duyck, 2003; Pacl et al., 2004), it becomes clear that enhancing the “predictability” of the discovery process has become an immediate priority area for investment (Duyck, 2003).
Therefore, the question explored in this paper is: Can we increase predictive performance of the pharmaceutical fuzzy front-end innovation process—called discovery research—through front-loaded experimentation? By front loaded, we mean that different possible dimensions in which failure could occur should be tested early. The purpose of this study, then, is to show how front-loaded experimentation strategies can lead to increased predictive and business performance of discovery research. The unit of analysis is the experimentation and decision making carried out in the fuzzy front-end part of the innovation process, by a purposeful and adaptive entity—the innovation team—“by itself or in interaction with others, constructing an envisioned end state, taking action to reach it, and monitoring its progress” (Poole et al., 2000).
Using a Monte Carlo simulation-based Bayesian inference framework to study the predictive performance of the innovation process, our simulation results show that certain front-loaded strategies in pharmaceutical discovery increase the odds of compounds succeeding subsequent development testing, provided they were found positive in discovery. Also, increasing the number of parallel concept explorations to an optimum level in discovery research reduces significantly the probability of missed opportunities in development. However, in contrast to some practitioner views (DeWitte, 2002), simulation results show that front-loaded strategies do not significantly decrease the probability of missed opportunities in development. Nor can this study confirm the benefit of early front loading, integrating early knowledge on the therapeutic agent gained through virtual in-silico methods (Pickering, 2001).
The business implication of our simulation-based findings is that the key to reduced spend and overruns in pharmaceutical development is not simply the reduction in time-to-market nor efficiency enhancements, but is mainly to be found in discovery, where efforts to better understand drug candidates lead to higher success rates or lower attrition later in the innovation process.
Improving experimentation process predictability
Empirical studies acknowledge the vital role and value of search through experimentation in complex and novel environments such as semiconductor (West & Iansiti, 2003) and pharmaceutical R&D (Thomke et al., 1998; Thomke, 2003).
However, current experimentation research focuses mainly on strategies aimed at accelerating product development lead-time and enhancing efficiency. Thus, strategies are proposed to compress the experimentation process using concurrent engineering (Krishnan et al., 1997; Smith & Eppinger, 1997a, 1997b; Loch & Terwiesch, 1998; Roemer et al., 2000; Mihm et al., 2003) or to make it more cost effective (Thomke 1998a, 1998b).
Verganti (1999) argues for a front-loading mechanism he calls “planned flexibility,” which deals with uncertainty through early identification of specific critical areas of a given project and early planning for reaction measures, leading to improved time to market and product quality. Also, Thomke and Fujimoto’s (2000) case study at Toyota gives field support for front loading as an important methodology to accelerate product development. “Enlightened” experimenters use front-loaded development, exploiting early information to spot and solve problems as far upstream as possible (Thomke, 2001). Survey-based research of 29 Internet software development projects (MacCormack & Verganti, 2003) also provides support for the front-loading benefits argument. Here, for projects facing greater uncertainty, early technical and market feedback had a stronger association with performance. Finally, in the late 1990s pharmaceutical and biotech companies also discovered the benefits of finding potential failure modes as early as possible in the development process. In a case study of Millennium Pharmaceuticals, it was shown how new technologies for experimentation can form the basis for fundamentally rethinking the innovation process by shifting failures to earlier phases (Thomke, 2003).
Parallelism or the number of alternative approaches explored to solve a problem is known to improve the quality of the solution. Abernathy and Rosenbloom (1968) showed that it is common in technological development to explore several approaches so that the best approach can be chosen. More recently, problem-solving efficiency in complex and novel environments is associated with a broad exploration and framing of the solution space, reaching across multiple knowledge domains (Schrader et al., 1992; Iansiti, 1998; Golder & Tellis, 2004). Toyota tries not to converge too quickly on a “best guess” solution for its new designs. Instead, the company has a high regard for learning on multiple ideas in parallel, using a “set-based” approach to product development (Sobek II et al., 1999), improving the quality of the commercialized product. More recent research concludes that set-based coordination should be emphasized if either starvation costs or the cost of carrying multiple design options in parallel are low (Terwiesch et al., 2002). Loch et al.’s (2001) analysis of experimentation policies shows that the optimal mix of parallel and sequential testing depends on the ratio of the financial cost and the cost of testing. A recent analysis of NPD decision making based on a pharmaceutical product development case developed closed-form solutions for the optimal number of concept tests to be conducted under profit uncertainty (Dahan & Mendelson, 2001). Their key finding was that the optimal number of concept tests depends not only on the cost of testing and the scale of uncertainty, but also on the distribution shape of that uncertainty.
Finally, Mena et al. (2001) use a genetic algorithm-based simulation model to understand how the concepts of evolution and learning can be used to improve the product development process. They found that diversity of designs explored and process duration are by far the most important parameters in finding a satisfactory solution, while other factors were found to be negligible.
From the above as well as a recent literature review and meta-analysis on relationships between integrated product development (IPD) characteristics and project performance (Gerwin & Barrowman, 2002), we conclude that present experimentation behavior research strongly emphasizes the study of the impact of various experimentation strategies on development lead time and efficiency, performance variables that are typical for product development and innovation research. No study was found to contribute to the exploration of predictive performance of experimentation strategies.
However, the need to improve the predictability of the experimentation process has recently been advocated by the pharmaceutical R&D community. Lesko et al. (2000) conclude that to get to better therapeutic agents with lower development risks, the pharmaceutical R&D process needs to move from an essentially empirical mode to a more mechanistic and predictive one. The general goal should be to integrate early knowledge gained during discovery into the drug development decision-making process. This approach would find failures faster, resulting in more economical and informative development programs. Or, more recently confirmed by Duyck in an influential paper, “The current lack of predictability not only represents a deficit in our knowledge base, but results in substantial opportunity cost, increased financial cost for therapeutic development, and limits on the potential impact of our basic research enterprise on public health” (Duyck, 2003).
Therefore, in the following section, experimentation strategy in pharmaceutical discovery will be explored in one of the top-10 pharmaceutical R&D operations that we will further refer to as PharmaCo. This will form the empirical base for the simulation-based study.
Exploring experimentation strategy in pharmaceutical discovery
The pharmaceutical discovery process
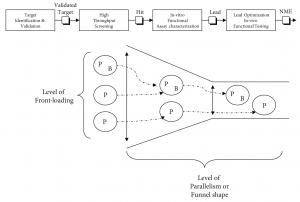
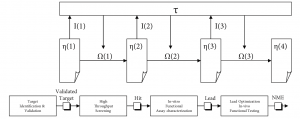
Before exploring the predictive performance of experimentation strategies in pharmaceutical discovery, the process needs to be understood. Figure 1 provides an overview of a typical drug discovery process as found in a major R&D operation[1]. Once a biological target is validated during “Target Identification & Validation,” the pharmaceutical drug discovery process aims to find a therapeutic agent with positive effect on this scientifically and commercially interesting target. It proceeds in essentially two stages: screening and optimization.
First, during “High Throughput Screening” (HTS) a lead molecule is selected from a diverse compound collection, constituting a chemical library. A typical major drug company will have hundreds of thousands to millions of compounds in its collection, typically valued at $50—140 million or more (Young et al., 1997). Alternatively, combinatorial chemistry has come into recent use to create large collections of candidate compounds screened for their effect on the biological target (Thomke et al., 1998). The candidate compound or “Hit” coming out of this screening process will be modestly potent. Therefore, in a second stage the candidate compound will be optimized by synthetically adding or removing parts using medicinal chemistry. This proceeds in two steps: lab-based—in-vitro—characterization or Hit-to-Lead (H2L), and animal-based—in-vivo—Lead Optimization (LO). This results in a candidate compound becoming more and more complex in structure as a result of the discovery process. Essentially, “Hit” structures serve as initial starting points to be optimized into “drug-like” leads (Oprea et al., 2001). The final product is a new molecular entity (NME) to be transferred into clinical development for further testing in humans.
Alternative?discovery?experimentation?strategies?considered
Emulating?the?bio-availability?surrogate?marker?chain
The practitioner literature (Macdonald & Smith, 2001; Oprea, 2002; DeWitte, 2002) develops a scientific viewpoint on a number of experimental designs available to run this screening and optimization drug discovery process. It can be summarized with regard to the level of front loading and parallelization that is used in the discovery process (Figure 1), the latter indicating the shape of the discovery funnel.
The level of parallelism can be measured by the number of candidate classes[2] retained for a drug target during the various stages of the discovery process, which reflects the shape of the discovery funnel. Typically in PharmaCo one to five classes showing activity against a target are selected in HTS screening, and one to three classes are further analyzed in H2L and carried through to LO. A narrow funnel, then, would be characterized by the couple (HTS, H2L/LO) = (1, 1). Conversely, a broad funnel would be characterized by the couple (HTS, H2L/LO) = (5, 3). The main cost driver is the number of classes carried through to LO.
The level of front loading can be measured by the number of variables—P and/or B[3]—considered at differing stages during Discovery; the most front-loaded strategy uses P and B from HTS on, the least front-loaded strategy only uses P during the entire process, disregarding B.
Alternative?front-loaded?strategies?for?discovery?research?experimentation
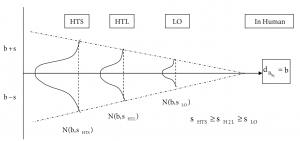
Finally, exploratory case-study analysis showed that along the discovery process scientists use surrogate measures for the variable they are ultimately interested in.
This is because scientific methods or surrogate markers for an ultimate variable of interest become more accurate as one proceeds in the discovery phases, which explains the funnel shape above. As an example, bio-availability in humans—b in Figure 2—is first measured in HTS using a rough decision rule set, to get an initial idea about this critical compound property based on virtual bioinformatics data only. Then, in H2L a more refined in-vitro method is used, and the final decision in LO is made using animal tests.
Now, for this study we define the predictive power of this surrogate marker chain, given by the correlation of the successive measurement methods. The higher the correlation between the various methods in the chain, the tighter the chain, and the better its predictive power will be. Within PharmaCo, a tightness level of 70% for all variables studied can be assumed.
Discovery experimentation strategies
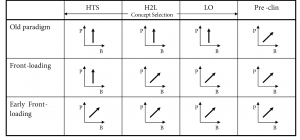
The three front-loaded experimental strategies for discovery research considered for subsequent comparative analysis are summarized in Figure 3. The arrows indicate which property classes are used in the prototype compound optimization cycles to converge to an NME. A vertical arrow indicates that only biological activity (P) or potency and selectivity is optimized, an arrow along the diagonal indicates that both biological activity and drug likeness or bioavailability properties (B) are used in multi-factorial optimization cycles.
In the old paradigm, applied in the industry some time ago, discovery research was only concerned about biological activity or potency and selectivity of a candidate compound. Drug-likeness properties were only taken into account from pre-clinical research on, which is a time- and effort-consuming process (Oprea, 2002). This strategy was not entirely successful, since within the industry only one in ten candidate drugs succeeded through clinical trials to reach the market (Drews, 1998).
In the front-loaded paradigm, both biological activity and pharmacokinetic properties are optimized simultaneously from the Hit-to-Lead (H2L) stage on. Here, confirmed hits series from HTS are prioritized and analyzed for problems. Progressive increments in biological activity and bio-availability are obtained by addressing the appropriate molecular determinants that define the desired compound characteristics.
Also, this paradigm is more generous in promoting selected candidate compounds through the H2L and LO process. This argues against a too narrow idea funnel and means that more candidates will reach LO status. Although this is an expensive recommendation, it does prevent candidate eliminations due to tests that mimic reality with statistical inaccuracy, the latter compounded to the number of tests conducted (DeWitte, 2002). The idea, then, is to build up knowledge through to in-vivo of a series of candidates instead of going for a fast attrition based on “in-silico” or in-vitro tests with low predictive power, and running LO with a small subset of “winning” candidate series of compounds.
Finally, early front loading takes the front-loaded paradigm even further, selecting the most promising classes based on the fullest multi-factorial picture available using virtual “in-silico” screening technology during HTS (Oprea, 2002).
Generalizing, our theory-building effort leads us to define residual ambiguity as all non-characterized solution variables of a candidate solution concept, their causal relationships and/or related problem-solving mechanisms at a point in time during the emergence of the solution to an innovation problem. From the above, it will be clear that front-loaded experimentation strategies aim for more extensive candidate characterization or lower levels of residual ambiguity than old-paradigm strategies at the end of discovery before transferring the therapeutic candidate into clinical development.
Now, to quantitatively evaluate predictive performance of discovery experimentation strategies, an analytical framework needs to be developed. This is the subject of the next section.
Modeling experimentation strategies’ performance
Predictive performance
Predictive performance can be intuitively defined as the accuracy with which compounds are promoted to therapeutic candidate or NME[4] status, as confirmed by later clinical development. To build a quantitative model of experimentation strategy variables—levels of front loading and parallelism- influencing predictive performance—a more formal notation is required.
Therefore, we distinguish between H+ and H—, being numbers of compounds declared respectively as active or inactive by the discovery experimentation strategy. The former is a set of therapeutic candidates that tested positive throughout the optimization process. During this process, a - virtually infinite - number of candidates
were eliminated from further optimization.
Then, active candidates declared NMEs by the discovery experimentation strategy will subsequently be confirmed to be positive or negative in clinical development. We need then to distinguish between C+ and C— as the number of NMEs respectively passing the latter development phases or not.
To evaluate the predictive performance of a discovery experimentation strategy, the following question must be answered: “What is the probability that a candidate is really active, denoted as
?” To answer this question, we must start from the universe of potential therapeutic agents H and examine how the experimentation strategy improves the odds of finding an active compound. This representation of uncertainty about parameters using conditional probabilities is called Bayesian inference. It models the experimentation strategy as a learning process that modifies one’s initial probability statement about the prevalence p or p (C+) prior to observing the data during experimentation to updated or posterior knowledge incorporating both prior knowledge and the data at hand (Congdon, 2001).
The positive predictive value, then, denoted p (C+|H+) or p+, is read as the probability that a compound will actually pass clinical development p (C+) given that it has been declared active p (H+) by the experimentation strategy. Similarly, the probability that a compound will not pass clinical development p (C-), given it has been declared inactive p (H-) by the experimentation strategy, is called the negative predictive value, and denoted p (C—|H-). The fraction of active compounds that were mistakenly declared inactive by the experimentation strategy is called p— or p (C+|H-); the negative predictive value is denoted as 1—p— (Parmigiani, 2002). Hence, predictive performance of an experimentation strategy can be measured using two criteria ?:
An experimentation strategy featuring high positive and negative predictive performance, then, has a high value for p+ and a low p-. High values for p+ indicate high levels of clinical confirmation of the earlier discovery decision. Low levels of p— indicate a low level of missed opportunities for commercialization[5]. The transition from p to p+ and p- models the learning about the true status of the universe of potential compounds H. Using the Bayesian logic set out above, it quantifies how inferences about the universe of potential compounds H are updated in the light of new evidence, provided by the experimentation strategy.
Business performance
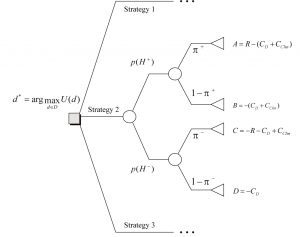
To formally state the problem of an R&D manager having to choose between various experimentation strategies, the optimal business decision for a strategy d* can be modelled as follows (Müller, 1999: 99; Parmigiani, 2002):
where
U(d) is the expected utility of an experimentation strategy d, an element of the universe of possible experimentation strategies D. The utility function u(d,?,y) is in our case specified by solving a decision tree of the outcomes y of the various (H, C) combinations. Ordering these combinations in a decision tree, and based on cost assumptions for each branch of the tree, a financial outcome can be calculated and used for comparison to make the best decision d*.
Figure 4 gives a decision tree representation of the best choice d* (depicted as a rectangle) to be made between the three discovery experimentation strategies, building on p+ and p- derived above. Overall, the depicted tree[6] represents the two-step decision to take a therapeutic agent to market.
The best choice at the decision node is the experimentation strategy option corresponding to the branch that leads to the maximum value (see a.o. Jensen, 2001). Solving a decision tree in Figure 4 leads to the following utility or business value U(d) for an experimentation strategy d:
Calculating U(d), then, leads to the best business choice between various experimentation strategies; the strategy delivering the maximum business value will be preferred.
Simulation study rationale and methodology
Monte Carlo simulation study rationale
Various reasons led us to conclude that computer-based simulation is the preferred research methodology to study the impact of various experimentation strategies on predictive and business performance using the Bayesian framework developed above.
First, the dynamics of problem-solving behavior are not analytically tractable while they have to be represented using discontinuous nonlinear systems, which are generally hard to describe in closed form (Mihm et al., 2003).
Second, some of the variables like or their derived probabilities like p(C-|H+) or p(C+|H-) among others are unobservable in real life, thereby resisting real-life experiments and empirical research (Masuch & Lapotin, 1989).
And finally, a Monte Carlo simulation-based research methodology allows us to vary underlying assumptions and to search virtually for optimal experimentation approaches in very high-dimensional spaces without disrupting practice (Parmigiani, 2002).
Generating a virtual search space
To run a simulation study, a virtual cohort of candidate therapeutic agents or chemical compounds needs to be generated and used to calculate the probability density functions cited above. More specifically, we chose to model a virtual compound having three fundamental virtual properties: Potency (P), Bioavailability (B), and Toxicity (T).
Now, as depicted in Figure 5, the extant search space is the total number of virtual compounds it contains. It is generated in several steps. First, classes get assigned a value for (P), (B), and (T) through random sampling of the exponential distributions we defined for these properties. Then, around these class values, reference compounds are randomly generated using a normal distribution. This is done while, in reality, classes are investigated by scientists in HTS and H2L by using a set of reference compounds describing the classes. Finally, virtual compounds are randomly generated around reference compounds using a normal distribution.
The simulation experiment, then, uses this virtual search space as input to the discovery screening and optimization experimentation process. Before analyzing predictive and business performance of the three experimentation strategies—old paradigm, front-loaded (FL) paradigm, Early front loading (EFL), we need to explain how the experimentation process was emulated in the simulation.
Utility?calculation?and?optimal?strategy?choice?decision?tree?model
Virtual?search?space?composition
Adaptive systems emulation of the discovery process
Using a simulation methodology, a formal model of the discovery research process needs to be designed. Among garbage can models (Cohen et al., 1972) and physical symbol systems (Newell & Simon, 1976; Masuch & Lapotin, 1989) of organizational decision making, massively parallel connectionist (Rumelhart et al., 1986) and evolutionary computation models like adaptive systems (Holland, 1992, 1998; Mitchell, 2001), we argue that the latter adaptive system (Holland, 1992) is the best artificial reconstruction of the mental modeling process during pharmaceutical discovery research since it mimics best the “selection and optimization” search for an NME in a vast, discontinuous multi-factorial solution space.
According to Mitchell (2001), this adaptive search method 1) initially generates a set of candidate solutions; 2) evaluates the candidate solutions according to some fitness criteria; 3) decides on the basis of this evaluation which candidates will be kept and which will be discarded; and 4) produces further variants by using some kind of operators on the surviving candidates.
Adaptive?systems?model?of?the?discovery?experimentation?process
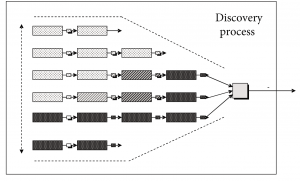
Therefore, an annotated[7] adaptive systems model served as the theoretical paradigm underlying the simulation study, in which each experimentation strategy used in a pharmaceutical discovery context is modeled to execute an adaptive plan.
Referring to Figure 6 and using Holland’s (1992) notation, this adaptive plan t starts from the universe of potential compounds representing the extant search space and initial uncertainty about the environment. Only an extremely small fraction of this universe is composed of candidate compounds with therapeutic effect. Through the execution of successive “noisy” selection and optimization loops, the total set of chemical structures attainable at moment t, ?(t), is modified by a set of operators O(t) based on information I(t) received by t at time t. This way, the adaptive plan improves the fit of the solution with the target.
The screening and optimization process on a validated target starts in HTS at the level of the chemical classes to end at candidate compound level. The top-performing classes and compounds are selected using payoff information on two or more properties. I(t) varies depending on the experimentation strategy used; or only biological activity information is used to find the best performer; or a multi-objective function combining payoff information on both biological activity and bio-availability dimensions is used to find the best-performing compounds in the search space. All experimentation strategies are modeled to only deal with chemical class-related performance in HTS and H2L, and with chemical compound-related performance in LO. Both front-loaded and early front-loaded strategies use multi-objective optimization, but start doing so at different moments in the process. The chosen multi-objective function conservatively takes the minimum of both (P) and (B) detector values as the calculated performance value for the chemical class or candidate compound, depending on the discovery research phase. At all stages a compound’s toxicology profile (T) needs a minimum level to pass.
The conceptual model specified above formed the basis to build a computer simulation program in Excel Visual Basic Applications (VBA). Theory building results using simulation-based experiments will be discussed in the following paragraphs.
Monte Carlo simulation results
Simulation model behavior
All experiments were executed within a Monte Carlo design. Two-way ANOVA screening experiments (n=100) showed that the simulation method used only provides meaningful results within an operating window determined by 1) the ruggedness of the solution landscape; and 2) the number of compounds selected in LO; (p). As to ruggedness, to get meaningful results standard deviations were not allowed to move beyond SD=1. Also, when (p) was allowed to move below a certain threshold, results again became meaningless. Therefore, simulation experiments were conducted at p=15 out of 24,000 initial virtual compounds leading to a p(H+) = 0.000625. This was the lowest possible value, which fits an industry average of about five compounds being advanced to clinical development out of 10,000 synthesized compounds (Furness, 2003).
Predictive?performance?of?experimentation?strategies?one-way?ANOVA?results?(n=200)
Then, selected simulation runs were repeated 200 times to obtain distributions of performance variables. One-way ANOVA was used on these performance data series to test for statistical significance of differences in predictive and business performance of experimentation strategies. Results of these Monte Carlo simulation experiments indicate that the level of front loading and the number of parallel solution concept explorations used significantly influence predictive and business performance.
In the following, outputs of the simulation runs are discussed in greater detail.
Influence of the level of front loading on predictive and business performance
Simulation experiments probing for the influence of the level of front loading on predictive and business performance were conducted assuming a (HTS, H2L) = (5, 2) funnel shape and a surrogate marker chain tightness of 70%. Both conditions reflect respectively best current operational reality and scientific constraints.
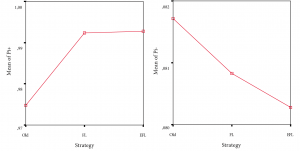
(1) Predictive performance. Figure 7 indicates that positive predictive performance of old paradigm, front-loading, and early front loading differ significantly [F(2, 596)=13,79; p<.01], although the actual differences in mean scores are quite small. Also, this result needs to be moderated by the fact that the effect size, calculated using eta squared, was 0.044, indicating a small to medium impact of the independent variables on the outcome variable. Levene’s test showed non-homogeneity of variance across the three groups—which we consider to be normal considering the different experimentation strategy types—implying the need for studying differences between groups at the p<.01 level of significance. Both Tukey’s HSD and Scheffe’s post-hoc comparisons indicated that old paradigm (M=0.974; SD=0.05) is significantly outperformed by front-loaded paradigm (M=0.992; SD=0.026), and early front loading (M=0.993; SD=0.036) at the p<.01 level of significance for positive predictive performance. Front-loaded paradigm and early front loading did not differ significantly. Also, negative predictive performance did not differ significantly across discovery experimentation strategies.
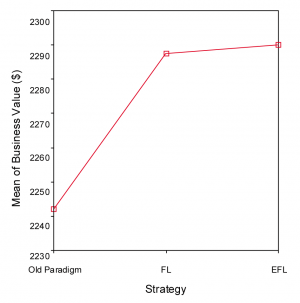
(2) Business performance. Financial assumptions used to perform this analysis include the following: product revenue R was assumed to build up linearly to one billion dollars a year in a period of seven years, a conservative estimation of a typical industry average blockbuster product (Duyck, 2003). CD and CClin amount to $20 and $400 million dollar respectively. These numbers represent typical project costs excluding the contribution for attrition, which is usually taken into account when specifying development costs (Kennedy, 1997; Duyck, 2003).
There was a statistically significant difference at the p<.01 level for the different experimentation strategies. Referring to Figure 8, old paradigm, front-loaded paradigm and early front loading differed significantly [F(2, 596)=12.9; p<.01] on business performance. This result needs to be moderated by the fact that the effect size, calculated using eta squared, was 0.041, indicating a small to medium impact of the independent variables on the outcome variable. Levene’s test showed non-homogeneity of variance across the three groups—which I consider to be normal considering the different experimentation strategy types—implying the need for studying differences between groups at the p<.01 level of significance.
Business?performance?of?experimentation?strategies?one-way?ANOVA?results?(n=200)
Both Tukey’s HSD and Scheffe’s post-hoc comparisons indicated that old paradigm (M=2241.9; SD=137.8) is significantly outperformed by front-loaded paradigm (M=2287.3; SD=78.2), and early front loading (M=2290; SD=94) at the p<.01 level of significance for business performance. Front-loading and early front loading did not differ significantly, although the difference does amount to $2.7 million in favor of early front loading using the above-mentioned assumptions.
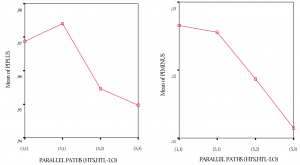
Influence of discovery exploration funnel on predictive and business performance
Simulation experiments probing for the influence of varying shapes of the discovery exploration funnel on predictive and business performance of early front-loaded experimentation strategies were conducted assuming a surrogate marker chain tightness of 70%, which reflects best current scientific constraints.
(1) Predictive performance. Referring to Figure 9, positive [F(3, 769)=23,84; p<.01] and negative [F(3, 796)=21.93; p<.01] predictive performance for the various front-loaded funnel shaping strategies differed significantly, although the actual differences in mean scores are quite small. Effect size, calculated using eta squared, was 0.084 and 0.077 for positive and negative predictive performance respectively, indicating a medium impact of the independent variables on the outcome variables. Levene’s test showed non-homogeneity of variance across the three groups—which I consider to be normal considering the different experimentation strategy types—implying the need for studying differences between groups at the p<.01 level of significance.
Both Tukey’s HSD and Scheffe’s post-hoc comparisons for positive predictive performance indicated that a (1; 1) and a (5; 1) funnel shaping strategy both differ significantly from a (5; 2) and (5; 3) strategy at the p<.01 level of significance. A (5; 2) and a (5; 3) strategy do not differ significantly from each other.
Both Tukey’s HSD and Scheffe’s post-hoc comparisons for negative predictive performance indicated that a (1; 1) and a (5; 1) funnel shaping strategy both differ significantly from a (5; 2) strategy and (5; 3) strategy at the p<.01 level of significance. Also, (5; 2) and (5; 3) strategies differ significantly from each other at the p<.01 level of significance.
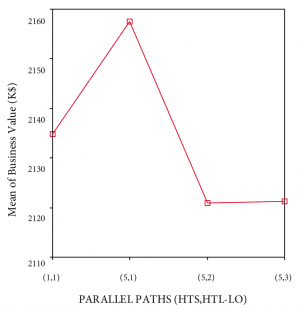
(2) Business performance. A one-way between-group analysis of variance was conducted to probe for the impact of various front-loaded funnel shapes on the business performance of the experimentation strategy used. There was a statistically significant difference at the p<.01 level for the different funnel shaping strategies. Financial assumptions used to perform ANOVA were discussed above.
Referring to Figure 10, business performance [F(3, 769)=7.9; p<.01] for the various front-loaded funnel shaping strategies differed significantly. This result needs to be moderated by the fact that the effect size, calculated using eta squared, was 0.031, indicating a small to medium impact of the independent variables on the outcome variable. Levene’s test showed homogeneity of variance across the three groups. Still, differences between groups were studied at the p<.01 level of significance.
Both Tukey’s HSD and Scheffe’s post-hoc comparisons for business performance indicated that a (5; 1) funnel shaping strategy (M=2157.5, SD=75.6) outperforms a (1; 1) strategy (M=2134.8, SD=99.1) by $22M and both a (5; 2) strategy (M=2120.9, SD=91.5) and (5; 3) strategy (M=2121.3, SD=79.3) by $36M, at the p<.01 level of significance. A (1; 1) strategy does not differ significantly from the others and a (5; 2) and (5; 3) strategy do not differ significantly from each other.
Figure?9
Predictive performance of front-loaded funnel shaping strategies one-way ANOVA results (n=200)
Business?performance?of?front-loaded?funnel?shaping?strategies?one-way?ANOVA?results?(n=200)
Discussion
Two key dimensions of experimentation strategies for pharmaceutical discovery were used for theorizing in the computer simulation described above: 1) the number of solution variables and problem-solving mechanisms characterized at various points during the discovery experimentation process; and 2) the shape of the solution concept exploration funnel.
(1) The effect of front loading. Both front-loaded strategies (early front loading and front loading) significantly outperform the old paradigm experimentation strategy on positive predictive performance. However, the difference between both front-loaded strategies is insignificant, meaning in the context of pharmaceutical discovery that, in contrast to some practitioner views (Pickering, 2001; Oprea, 2002; Yu & Adedayo, 2003), in-silico characterization of bio-availability does not significantly increase positive predictive value as compared to its characterization starting in H2L, as done in the front-loaded paradigm. Also, in contrast to some practitioner views (DeWitte, 2002), our simulation results show non-significant differences in negative predictive performance for the various strategies.
Finally and most importantly, this simulation leads us to propose that there is an inverse relationship between the previously defined chosen level of residual ambiguity at the end of discovery research and its positive predictive value. In practical terms, an experimentation strategy favoring more extensive characterization—aiming for lower levels of residual ambiguity—of a solution concept in discovery will increase its chances of surviving development after having successfully passed discovery. However, it will not decrease the probability of missed opportunities in development.
A?summary?of?discovery?experimentation?strategies
(2) The effect of parallelism. Previous studies in technology-intensive industries indicate the benefits of broadening the concept testing funnel (Sobek II et al., 1999) or at least propose to optimize the shape of the concept funnel (Dahan & Mendelson, 2001). However, the impact of concept funnel shaping strategies on predictive performance has not been studied before.
In the simulation experiment, broadening the solution concept exploration funnel was found to have significant effects on predictive performance of an early front-loaded experimentation strategy during discovery. More specifically, broadening the funnel increases its negative predictive power, significantly decreasing the chances of missed opportunities in subsequent development. However, a minimum number of parallel concept explorations are required to gain effect. In contrast, simulation results showed that broadening the concept exploration funnel did significantly reduce the effect on positive predictive performance during discovery, significantly decreasing the chances of a candidate solution concept surviving development once promoted at the end of discovery.
(3) Business performance. This study’s simulation results indicate that front-loaded strategies applied during discovery lead to higher business value than old paradigm strategies. However, the difference in business performance between both early front-loaded and front-loaded strategies was insignificant. Also, broadening the concept funnel to a certain optimum point had a positive impact on business performance.
Finally, the Bayesian belief network logic allows us to calculate the overall effects of different experimentation strategies concerning the level of front loading and discovery funnel shape. Given the financial assumptions described above, and given a surrogate marker chain featuring a predictive power of 70%, we see in Figure 11 that the choice of an early front-loaded experimentation strategy together with the decision to apply a (5,1) funnel shaping strategy could lead to maximum business performance.
Validity considerations and limitations
Computer simulations are without doubt reliable, but the important question is whether a specific simulation model is an acceptable representation of the corresponding real system, given the goal of the simulation model (Kleijnen et al., 2001). Models for simulation purposes cannot be shown to be true or valid in any absolute sense. What can be said is that the model can be valid under certain assumptions. In this study, key assumptions were formulated to reduce the complexity of representing the innovation process without endangering the fulfilment of the research goal of theory development. In summary, three simplifying assumptions were made concerning the representation of the solution landscape, and for optimization and selection conducted during the innovation process.
First, the solution landscape was represented using three compound properties aggregated into reference compounds and chemical classes. This oversimplification of reality was necessary to make the implementation of the conceptual model possible in a VBA environment. Second, the innovation environment was represented as a mechanistic process of optimization stages concluded by a number of decision gates, where candidate solution concepts were promoted to the next stage or terminated if they did not fulfill the selection criteria. Respecting the garbage can philosophy, the complex scientist optimization behavior was conservatively reduced to a simple multi-factorial function, taking the minimum of the (P) and (B) values as an input to a search for maximum performance in an extant search space. White box validation (Pidd, 1992) of this process with PharmaCo scientists showed that the model behaves in a reasonable fashion, depicting a familiar universe of organizing the discovery research process, and confirmed the face validity of this complexity reduction of reality, provided it served the purpose of theory development.
However, considering the complexities of the probabilistic modelling of the innovation process and the hard-to-unravel nature of the model’s inner working, face validation was insufficient to claim internal validity of the simulation model. Therefore, validation ex negatio (Masuch & Lapotin, 1989) of key assumptions was done, showing that these assumptions do little harm to the model’s predictive power. This is why comparative performance conclusions about experimentation strategies were checked for robustness by varying the most basic parameters in the model. Thus, simulation results were shown to be robust for changes in solution landscape ruggedness up to a certain level, down to a certain level for varying numbers of the set of compounds declared active in LO, and for changes in the marginal probability p(H).
Finally, external validity must be gained through empirical observation of the model’s predictions. “The behavior of the ‘real’ system is observed under specified conditions and the model is then run under conditions which are as close as possible to these. If the model is valid in a black box sense, then the observations of the model should be indistinguishable from those of the ‘real’ system” (Pidd, 1992: 106). Recent experience at PharmaCo[8] suggests external validity of the findings that front loading outperforms other experimentation strategies on positive predictive performance. Further longitudinal research data on compounds declared active by discovery and succeeding clinical development at PharmaCo and other pharmaceutical companies would be required to gain sufficient empirical support for the model’s predictions. It should be noted here that the model’s predictions on negative predictive performance are not verifiable in practice, since the key conditional probability involved is not observable in practice.
Conclusion
This study is, we believe, a first step in exploring the implications of realizing that the NPD process is a complex adaptive system, which does not have a single pathway to an inevitable outcome. It attempts to conceptually and quantitatively relate policy variables used to manage the fuzzy front-end innovation process to predictive performance. Thus, it adds predictability as a performance dimension to evaluate the fuzzy front end policy—performance link. Doing so, it makes a contribution to a growing research agenda designing optimized experimentation strategies in highly ambiguous and uncertain solution spaces (Pelikan & Goldberg, 2003; Callan, 2003).
The annotated adaptive systems model of PharmaCo’s discovery research process produced reliable, internally valid results that could be used for theory generation.
More specifically, simulation results indicated that both front-loaded experimentation strategies and their solution concept exploration funnel shape influence significantly predictive and business performance of experimentation strategies. A further stage in the research may look at the question of conducting experiments and allowing for a change in the possible target in the light of what happens. This could increase the rate of discovery of new drugs further, and this would be of great benefit in the current situation.
Finally, as computer simulation was used as a technique for theorizing, further empirical validation of results is necessary to gain sufficient support for the model’s predictions. Most probably, falsification attempts in other pharmaceutical or research-intensive contexts will lead to modifications of the model’s present version, which only underlines the purpose of the model as a suitable adaptive theory generator.